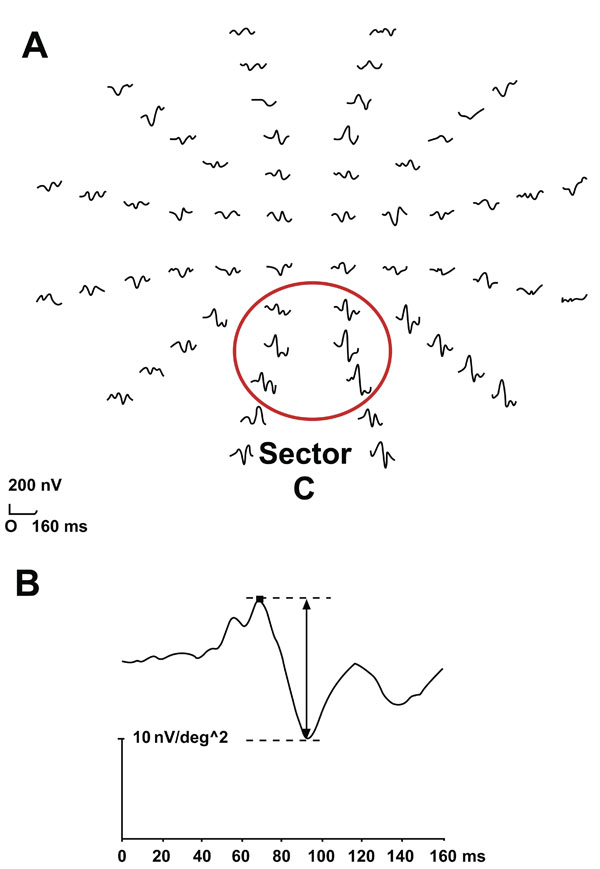
Fig. (1) A normal mfVEP. (A) Cortical responses to stimulation of
60 segments in the central visual field. The ring indicates sector C,
the region with the highest amplitudes when measured with the
midline electrodes. (B) The arrow indicates the peak-to-peak
amplitude of the first two components according to VERIS
program, which correlate to N 70 and P 100 in the classic VEP.