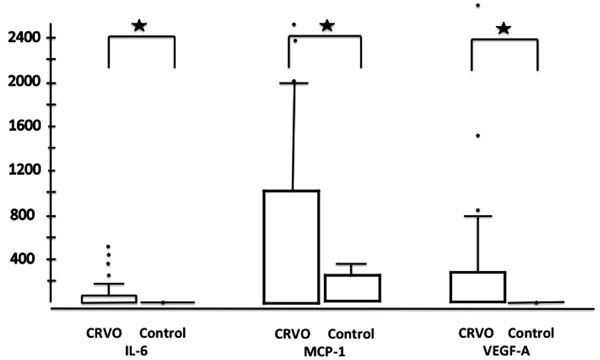
Fig. (2)
Bar plots with the values of cytokines (statistical extremes are marked with dots) for all CRVO patients (left bar plots; n=35) versus the control group (right bar plot; n=28); significant differences are noted with stars.