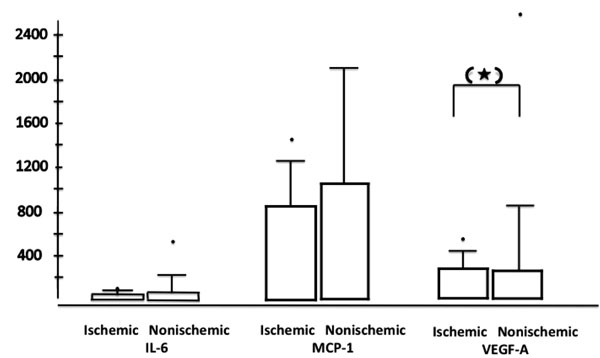
Fig. (3)
Bar plots with the values of cytokines (statistical extremes are marked with dots) for ischemic CRVO patients (left bar plots; n=15) versus non-ischemic CRVO patients (right bar plot; n=30); p=0.09 is marked with a star in brackets.