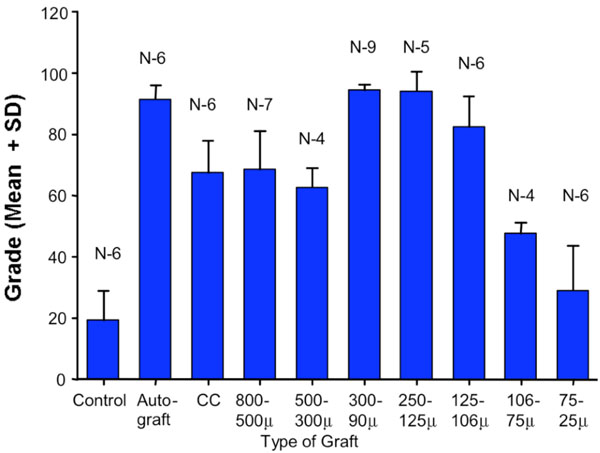
Fig. (2) Graphic representation with error bars of the assessment of defect healing using a scale of 100. Statistical significance of differences between experimental groups was established using Student’s t-test. Statistical data is summarized in Table 2.