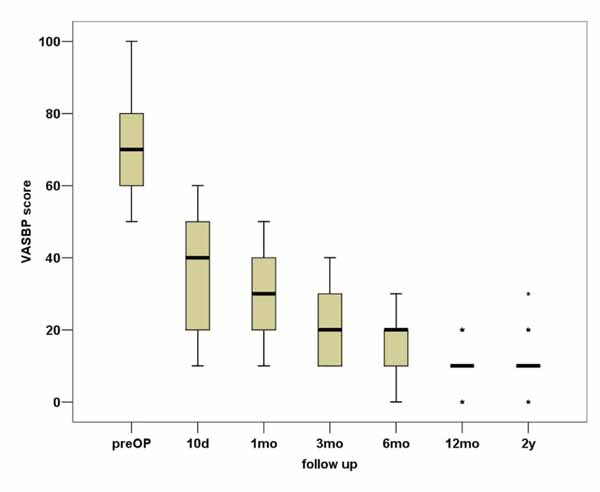
Fig. (4)
Box plot representation of the VASBP score during the 2-year follow-up.