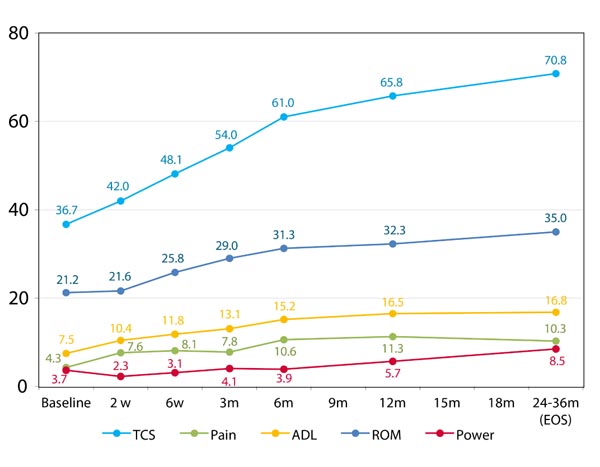
Fig. (2)
Graphical presentations of improvement of TCS over time at Protocol Population. Values are presented as means ±SD.