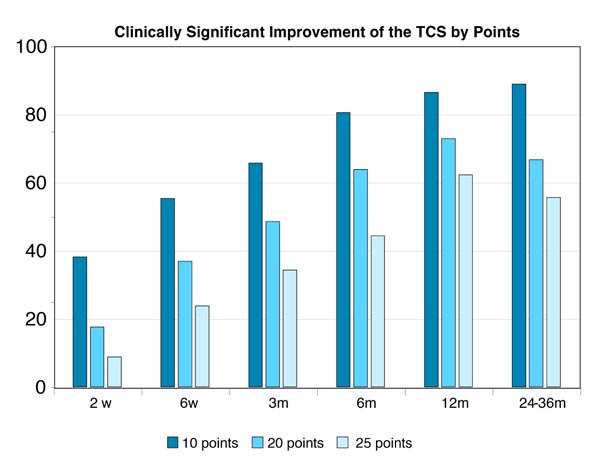
Fig. (4)
Graphical presentations of improvement in total CS during 2 years follow up. Values are presented as means ±SD.