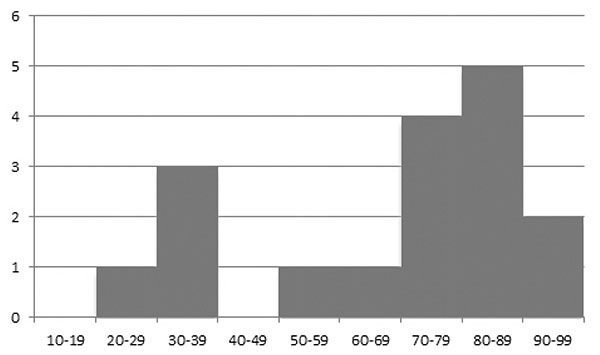
Fig. (4)
Graph demonstrating the age ranges on the x-axis and the number of cases described inth eliterature on the y-axis. A bimodal distribution is demonstrated.