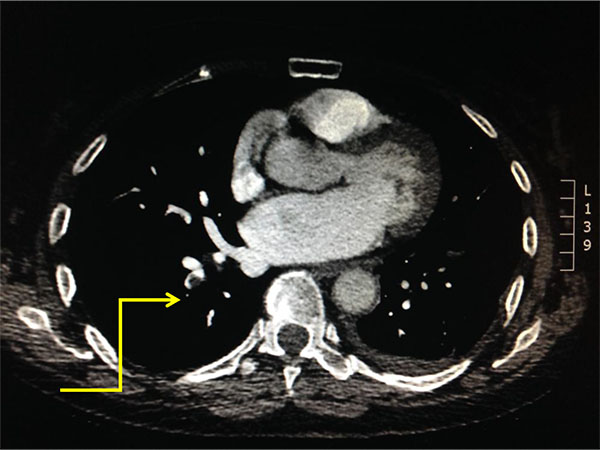
Fig. (8)
Bar chart highlighting the level of vessel affected by embolic disease amongst patients with a positive CTPA during the study period. Distribution of embolic event within the pulmonary vasculature.