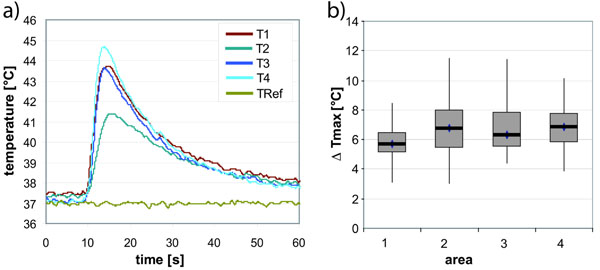
Fig. (5) Typical temperature record (a) showing the short temperature peak at four thermocouples around the pin (T1-4) and the reference measurement 2 cm from the insertion point (TRef). Results of the measurements are displayed as box blot diagram of the maximal temperature differences (b) for each area in the femur (area 1) and tibia (area 2-4).