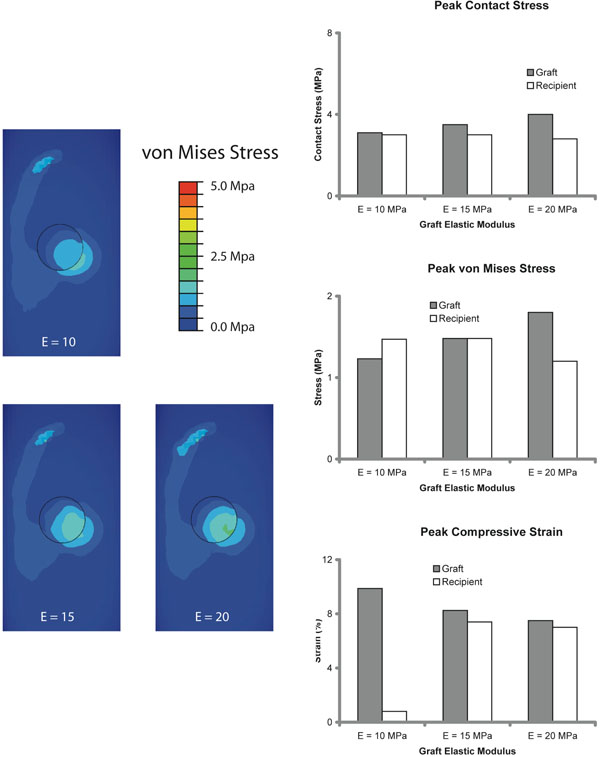
Fig. (4)
Results of Variation in Graft Modulus. Left column:
Contour maps of von Mises stress distribution for grafts of different stiffness (E = Young’s modulus).
Right column:
Graft stresses linearly increased with graft stiffness.