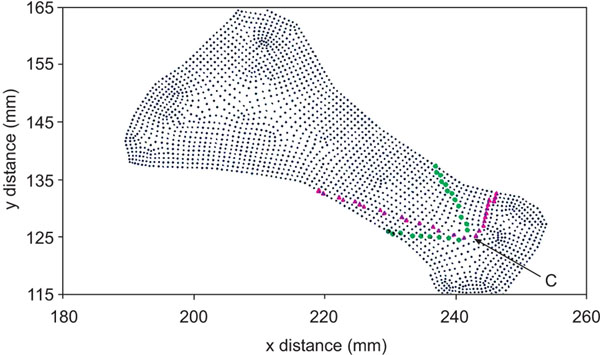
Fig. (4) A plane x-y view of the bone model shown in Fig. (3), with Finite Element Analysis nodes (tiny dots) created by the ANSYS software while evaluating normal and shear stresses with the 60o and 90o osteotomies. Due to the discrete nature of the analysis, the two osteotomies cannot be represented by exact straight segments. Filled triangles indicate the nodes chosen to represent the 900 osteotomy, whereas filled circles indicate the nodes chosen to represent the 600 osteotomy. Point C (arrow) is the center of the circle shown in Fig. (1).