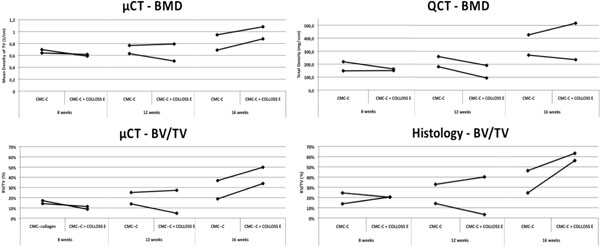
Fig. (2) Graphs illustrating the BMD and BV/TV data from QCT, µCT and histomorphometry. The BMD from the µCT data increase after 16 weeks in the Colloss E group, data that cannot be reproduced in the QCT data. The BMD does not vary between 8 and 12 weeks and no difference is observed between the two groups. This is the case for both the µCT and the QCT data. The BV/TV in the bottom two graphs show a similar trend between histomorphometry and µCT. There is no difference in BV/TV between 8 and 12 weeks and no increased BV/TV between control- an intervention group. At 16 weeks both µCT and histomorphometry data show an increased BV/TV in the CMC-C + Colloss E group compared to the CMC-C group.