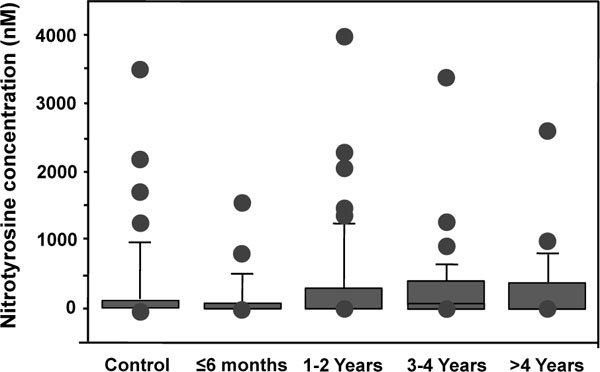
Fig. (4) Nitrotyrosine concentrations in the plasma of patients with MM THAs. Due to non-parametric distribution, results are presented as box plot in which outliers are represented by the dots (•) and the box by itself represents the middle 50% of the data.