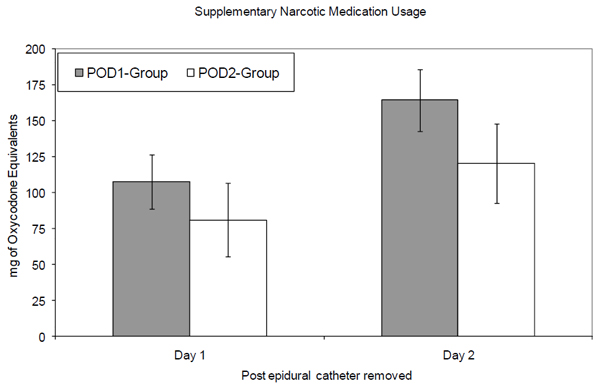
Fig. (1) Comparison of supplementary narcotic medication usage following epidural catheter removal by group. Mean cumulative narcotic usage in milligrams of oxycodone-equivalents are represented by the bars with the error bars representing the lower and upper bounds of the 95% confidence interval. The gray bars represent the POD1-group, while the white bars represent the POD2-group. Day 1 represents the first 24 hours since the epidural catheter was removed. Day 2 represents the second 24 hours since the epidural catheter was removed.