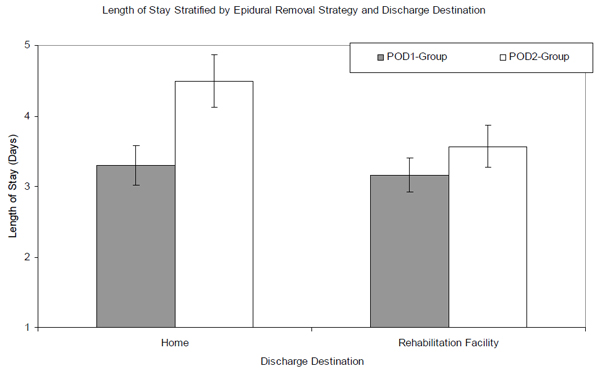
Fig. (2) Title: Mean length of stay stratified by epidural removal strategy and discharge destination. Mean length of stay, stratified by epidural-removal strategy using the robust regression with the bootstrap (10,000 replicates), are represented by the bars. The gray bars represent the POD1-group, while the white bars represent the POD2-group. The error bars represent the lower and upper bounds of the 95% confidence interval.