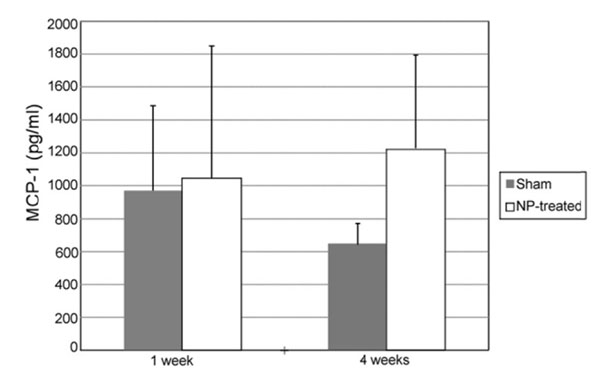
Fig. (6) MCP-1 concentration in the CSF: At 1 Week, MCP-1
concentration was comparable between NP-treated (n = 3) and
sham animals (n = 6). By week 4, NP-treated animals (n = 5)
tended to have higher levels of MCP-1 relative to sham (n = 4);
however, this difference was non-significant (p = 0.355). Data are
presented as mean ± standard error.