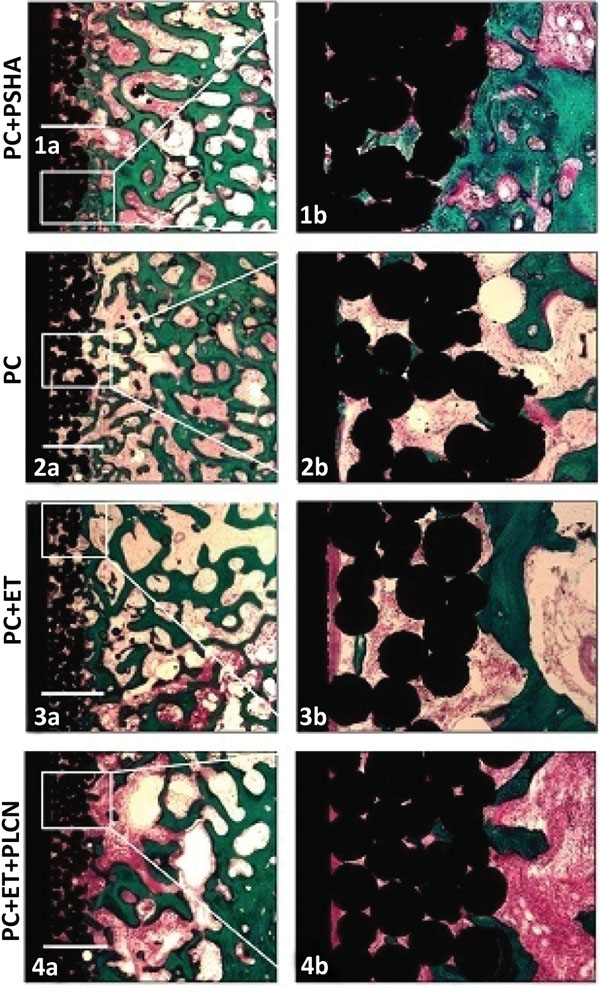
Fig. (2) Representative histological sections of the four different treatment groups. More new bone was seen on the PSHA implants in both regions of interest (1a+b) compared to the intervention groups (3a+b and 4a+b). The control group (2a+b) had more new bone in the deep surface implant porosity compared to the intervention groups (3a+b and 4a+b). Both of the etched implant groups showed a distinct rim of fibrous tissue along the core implant (3a+b and 4a+b). Bar = 1 mm.