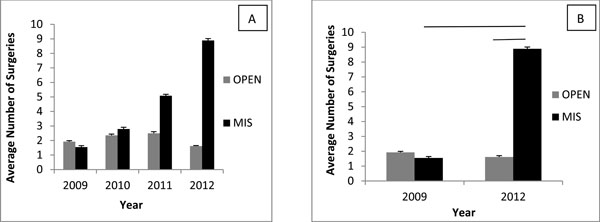
Fig. (2) Average Number of Procedures Performed from year 2009 to 2012. A) A year by year presentation of number of procedures
performed on average by the surveyed population. B) Comparison of the number of performed surgeries in 2009 and 2012.Statistical
Significance determined at p<0.0001 as presented by lines.