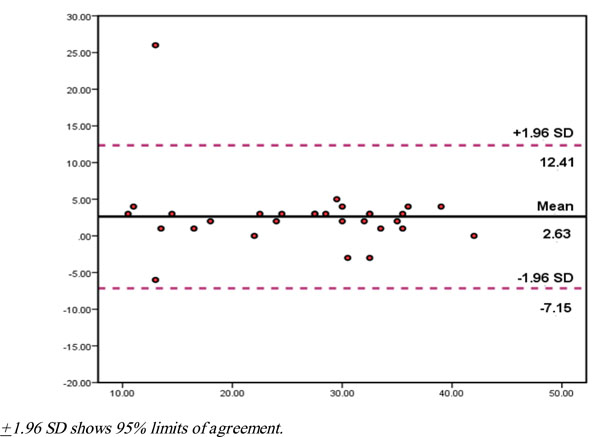
Fig. (2)
Bland and Altman plot for measuring with-in subject variation and the limits of agreement.