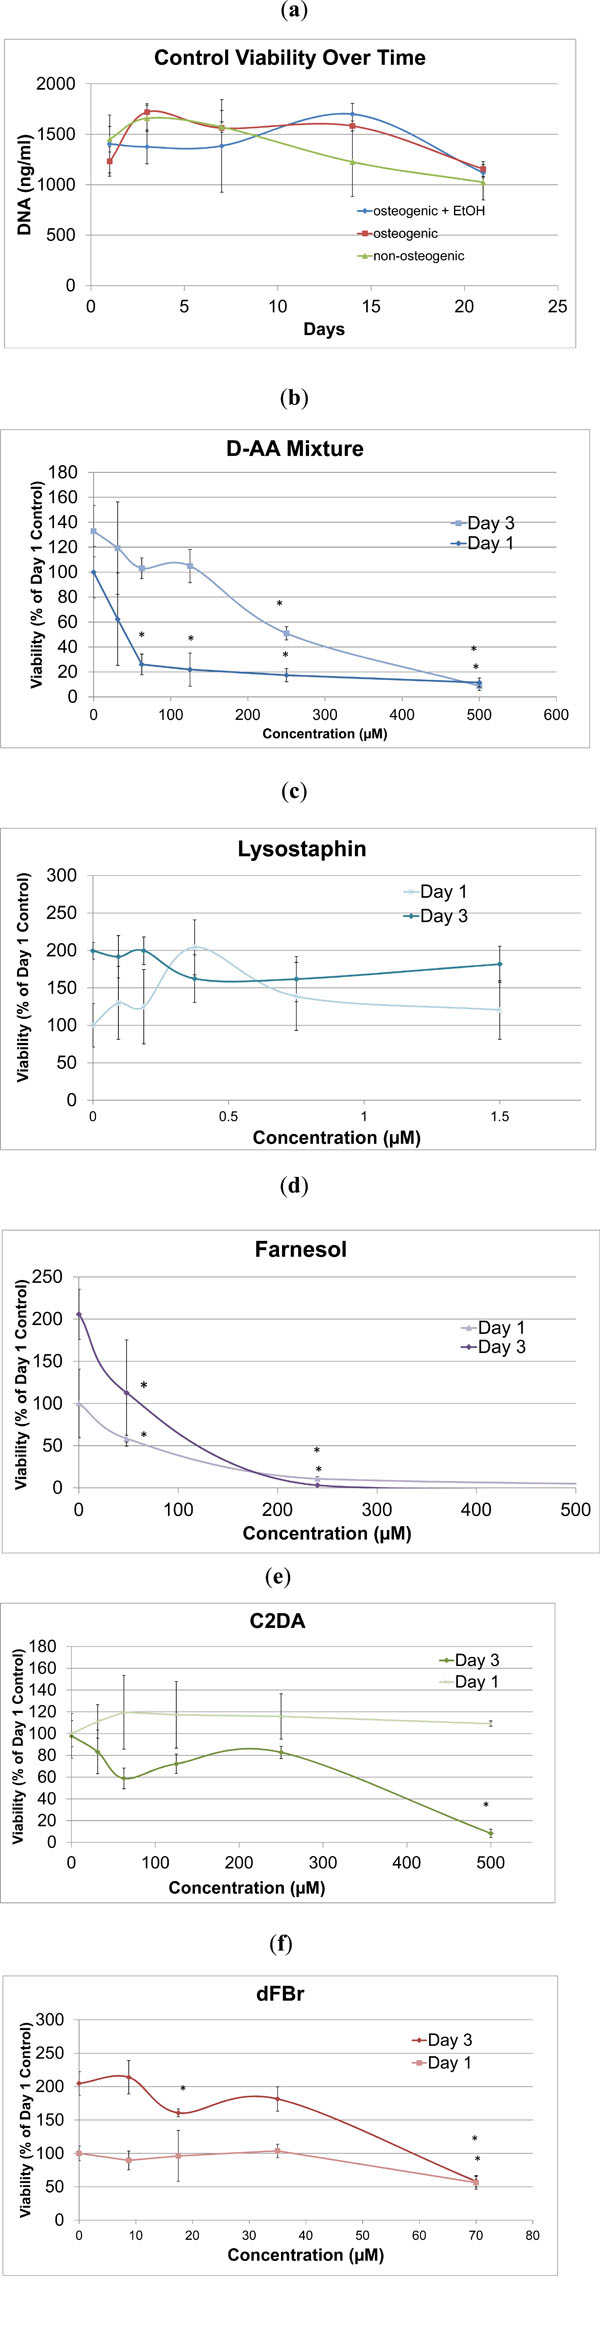
Fig. (1) DNA quantity for a) all the control groups and b-f) biofilm
inhibitors to osteogenic controls on day 1 and 3 at varying
concentrations. Data are represented as mean ± standard deviation;
*indicates significant difference compared to osteogenic control.