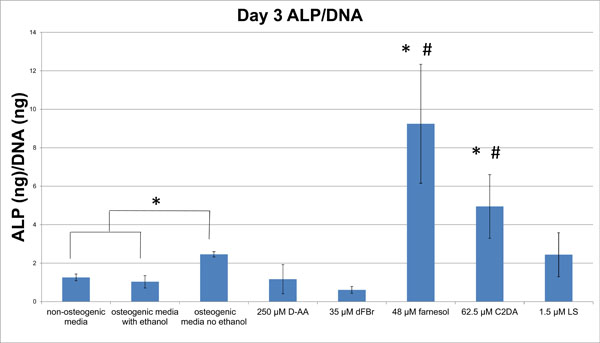
Fig. (4) Graphical representation comparing day 3 ALP/DNA production for control groups and sub-toxic concentrations of test groups.
Data are represented as mean ± standard deviation; * indicates significant difference compared to osteogenic control, # indicates significant
difference compared to osteogenic ethanol control.