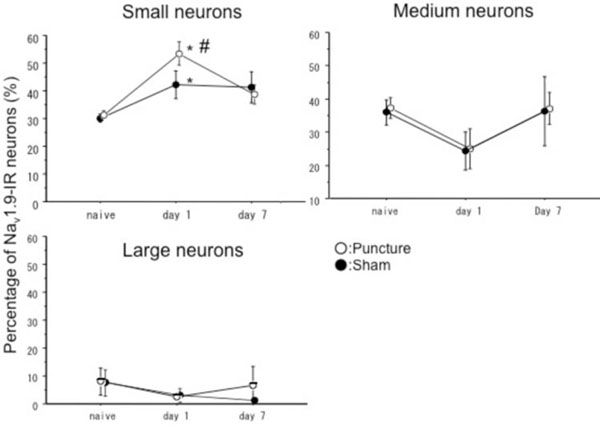
Fig. (4) These graphs show percentages of Nav 1.9-IR neurons in small sized neurons (<600µm2), medium sized (600-1200µm2) and large
sized neurons (>1200µm2). There were significant differences between puncture and naïve group, and sham and naïve group in small neurons
at Day 1. The percentage of Nav 1.8-IR neurons tend to be higher in small sized neurons in puncture group compared with sham group at
Day 1. There were no significant differences in medium and large sized neurons. There were no significant differences among three groups at
Day 7. *p<0.05 compared with naïve group, # p<0.1 compared with sham group.