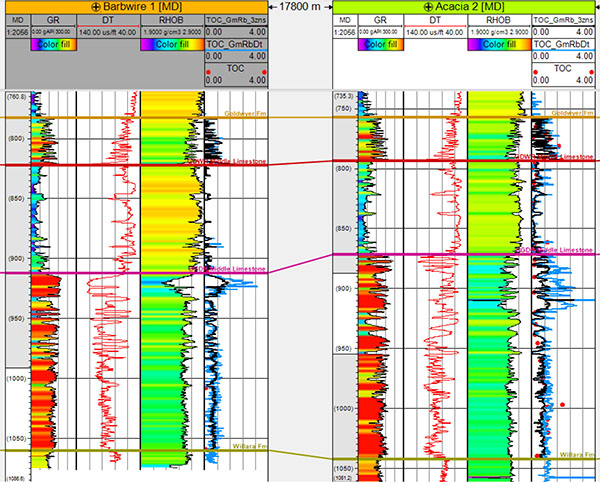
Fig. (12)
Right tracks of both wells show TOC logs derived from GR and RHOB independently for each Goldwyer zone (black curves) overlayed with TOC logs derived from GR, RHOB, and DT for the whole Goldwyer as one zone (blue curves). Wells Barbwire 1 and Acacia 2 are shown here as an example.