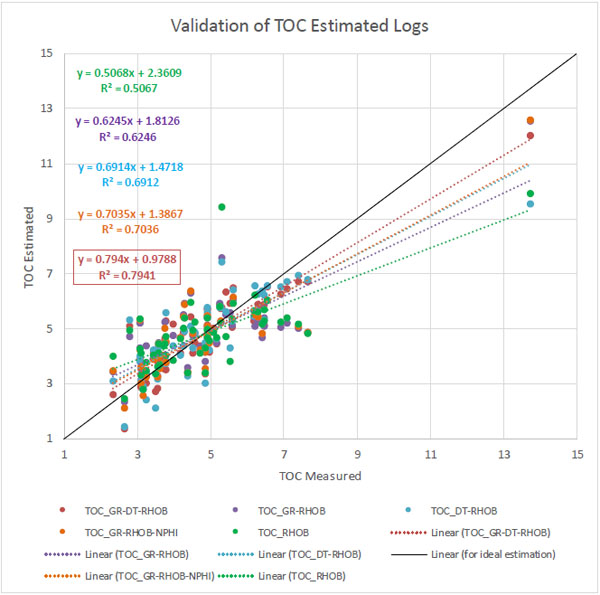
Fig. (14)
Estimated TOC values from different approaches are cross-plotted against TOC core measurements. The best approach is the one that is closest to the solid diagonal black line (TOC_GR-DT-RHOB), which has a trend line of highest correlation (highest R2), line slope closest to one, and y-intercept closest to zero