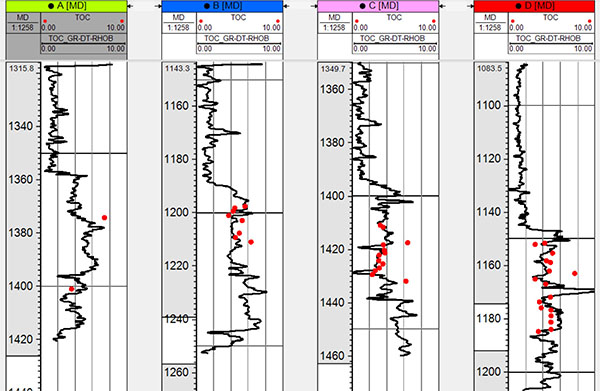
Fig. (15)
A cross-section of four wells showing TOC log (black curves) derived for the lacustrine source rock from gamma-ray, sonic transit time, and density plotted along with TOC core measurements (red points).