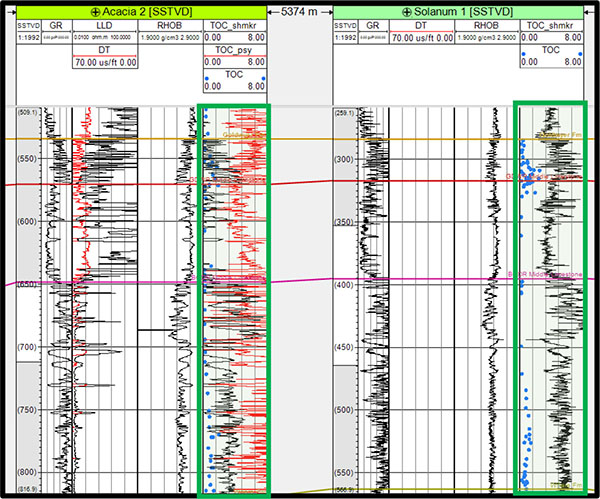
Fig. (5)
Overestimating TOC-Schmoker (black) and TOC-Passey (red) when compared to TOC sample measurements (blue data points) in the tracks to the right for wells Acacia 2 and Solanum 1.