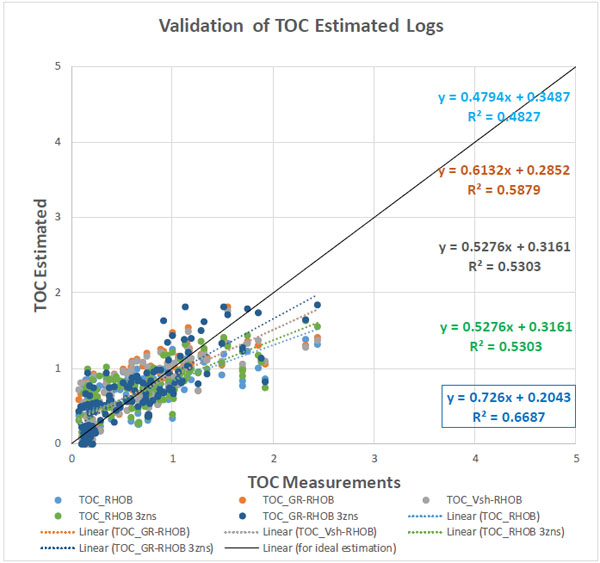
Fig. (9)
Estimated TOC values from different approaches are cross-plotted against TOC measurements from Rock-Eval. The best approach is the one that has a trend line of highest correlation (highest R2), line slope closest to one, and y-intercept closest to zero.