- Home
- About Journals
-
Information for Authors/ReviewersEditorial Policies
Publication Fee
Publication Cycle - Process Flowchart
Online Manuscript Submission and Tracking System
Publishing Ethics and Rectitude
Authorship
Author Benefits
Reviewer Guidelines
Guest Editor Guidelines
Peer Review Workflow
Quick Track Option
Copyediting Services
Bentham Open Membership
Bentham Open Advisory Board
Archiving Policies
Fabricating and Stating False Information
Post Publication Discussions and Corrections
Editorial Management
Advertise With Us
Funding Agencies
Rate List
Kudos
General FAQs
Special Fee Waivers and Discounts
- Contact
- Help
- About Us
- Search


The Open Petroleum Engineering Journal
(Discontinued)
ISSN: 1874-8341 ― Volume 12, 2019
Inflow Performance Relationship Correlation for Solution Gas-Drive Reservoirs Using Non-Parametric Regression Technique
Ahmed M. Daoud1, *, Mahmoud Abdel Salam2, Abdel Alim Hashem1, M.H. Sayyouh1
Abstract
Background:
The Inflow Performance Relationship (IPR) describes the behavior of flow rate with flowing pressure, which is an important tool in understanding the well productivity. Different correlations to model this behavior can be classified into empirically-derived and analytically-derived correlations. The empirically-derived are those derived from field or simulation data. The analytically-derived are those derived from basic principle of mass balance that describes multiphase flow within the reservoir. The empirical correlations suffer from the limited ranges of data used in its generation and they are not function of reservoir rock and fluid data that vary per each reservoir. The analytical correlations suffer from the difficulty of obtaining their input data for its application.
Objectives:
In this work, the effects of wide range of rock and fluid properties on IPR for solution gas-drive reservoirs were studied using 3D radial single well simulation models to generate a general IPR correlation that functions of the highly sensitive rock and fluid data.
Methodology:
More than 500 combinations of rock and fluid properties were used to generate different IPRs. Non-linear regression was used to get one distinct parameter representing each IPR. Then a non-parametric regression was used to generate the general IPR correlation. The generated IPR correlation was tested on nine synthetic and three field cases.
Results & Conclusion:
The results showed the high application range of the proposed correlation compared to others that failed to predict the IPR. Moreover, the proposed correlation has an advantage that it is explicitly function of rock and fluid properties that vary per each reservoir.
Article Information

Identifiers and Pagination:
Year: 2017Volume: 10
First Page: 152
Last Page: 176
Publisher Id: TOPEJ-10-152
DOI: 10.2174/1874834101710010152
Article History:
Received Date: 28/03/2017Revision Received Date: 08/05/2017
Acceptance Date: 13/06/2017
Electronic publication date: 12/08/2017
Collection year: 2017
open-access license: This is an open access article distributed under the terms of the Creative Commons Attribution 4.0 International Public License (CC-BY 4.0), a copy of which is available at: https://creativecommons.org/licenses/by/4.0/legalcode. This license permits unrestricted use, distribution, and reproduction in any medium, provided the original author and source are credited.
Correspondence: Address correspondence to this author at the Department of Petroleum Engineering, Cairo University, Giza, Egypt; Tel: +965-972-59268; E-mails: adawood@slb.com; a_daoud_72@yahoo.com
| Open Peer Review Details | |||
|---|---|---|---|
| Manuscript submitted on 28-03-2017 |
Original Manuscript | Inflow Performance Relationship Correlation for Solution Gas-Drive Reservoirs Using Non-Parametric Regression Technique | |
1. INTRODUCTION
Predicting the relationship between the flow rate and the pressure drop performance in the reservoir is very important for continuous production optimization. IPR curve can be combined with tubing performance curve to monitor well productivity, designing production and artificial lift equipment and to choose the proper remedial treatment options (acidizing, fracturing, work over, etc.) for optimum well performance.
In calculating oil production, it was assumed that an oil production rate is directly proportional to draw down. Using this assumption, well’s behavior can be described by productivity index; PI. This PI relationship was developed from Darcy’s law for steady state radial flow of a single incompressible fluid.
 |
(1) |
Evinger and Muskat [1H.H. Evinger, and M. Muskat, "Calculation of Theoretical Productivity Factors", Trans. Metall. Soc. AIME, vol. 146, pp. 126-139, 1942.
[http://dx.doi.org/10.2118/942126-G] ] pointed that the above relationship is not valid for two phase flow.
The first presentation of an inflow performance relationship (IPR) was made by Rawlins and Schellhardt [2E.L. Rawlins, and M.A. Schellhardt, “Backpressure Data on Natural Gas Wells and Their Application to Production Practices”, Monograph Series 7, U.S. Bureau of Mines., American Gas Association, Lord Baltimore Press, 1935.]. They used their plot to show the effect of liquid loading on the production performance of gas wells. Gilbert [3W.E. Gilbert, "Flowing and Gas-Lift Well Performance", In: American Petroleum Institute Proceedings, 1954, pp. 126-157.] introduced the concept of an “Inflow Performance Relationship” (IPR).
Based on our literature survey, the different IPR correlations can be divided into empirically-derived and analytically-derived correlations.
1.1. The empirically derived correlations are:
- Vogel [4J.V. Vogel, "Inflow Performance Relationships for Solution Gas-Drive Wells", J. Pet. Technol., vol. 20, pp. 83-92, 1968.
[http://dx.doi.org/10.2118/1476-PA] ] - Fetkovich [5M.J. Fetkovich, "The Isochronal Testing of Oil Wells", In: SPE Annual Meeting, September 30-October 3, Las Vegas, NV, 1973.
[http://dx.doi.org/10.2118/4529-MS] ] - Jones et al. [6L.G. Jones, E.M. Blount, and O.H. Glaze, "Use of Short Term Multiple Rate Flow Tests to Predict Performance of Wells Having Turbulence", In: SPE Annual Technical Meeting and Exhibition, Oct. 3-6, New Orleans, 1976.
[http://dx.doi.org/10.2118/6133-MS] ] - Richardson and Shaw [7J.M. Richardson, and A.H. Shaw, "Two-Rate IPR Testing — A Practical Production Tool", J. Can. Pet. Technol., vol. 21, pp. 57-61, 1982.
[http://dx.doi.org/10.2118/82-02-01] ] - Wiggins [8M.L. Wiggins, "Inflow Performance of Oil Wells Producing Water", Ph.D. dissertation, College Station, TX, Texas A&M University, 1991., 9M.L. Wiggins, "Generalized Inflow Performance Relationships for Three-Phase flow", SPE Production Operations Symposium Oklahoma City : 1993, March 21-23.
[http://dx.doi.org/10.2118/25458-MS] ] - Klins and Majcher [10M.A. Klins, and M.W. Majcher, "Inflow Performance Relationships for Damaged or Improved Wells Producing Under Solution-Gas Drive", J. Pet. Technol., vol. 44, pp. 1357-1363, 1992.
[http://dx.doi.org/10.2118/19852-PA] ] - Sukarno and Wisnogroho [11P. Sukarno, and A. Wisnogroho, "Generalized Two-Phase IPR Curve Equation under Influence of Non-linear Flow Efficiency", In: Society of Indonesian Petroleum Engineers Production Optimization International Symposium Conference Proceeding, Bandung, Indonesia, 1995.]
1.2. The Analytical correlations are:
- Wiggins et al. [8M.L. Wiggins, "Inflow Performance of Oil Wells Producing Water", Ph.D. dissertation, College Station, TX, Texas A&M University, 1991., 12M.L. Wiggins, J.L. Russel, and J.W. Jennings, "Analytical Inflow Performance Relationships for Three Phase Flow in Bounded Reservoirs", In: SPE Western Regional Meeting, March 30-April 1, California, 1992.
[http://dx.doi.org/10.2118/24055-MS] ] - Del Castillo et al. [13Y. Del Castillo, "New Inflow Performance Relationships for Gas Condensate Reservoirs", M.S. Thesis, College Station, TX, Texas A & M University, May 2003., 14R.A. Archer, Y. Del Castillo, and T. Blasingame, "New Perspectives on Vogel Type IPR Models for Gas Condensate and Solution-Gas Drive Systems", SPE Production Operations Symposium, 2003 Oklahoma, OK
[http://dx.doi.org/10.2118/80907-MS] ]
Detailed description of all the above IPR models is given on Abdel Salam [15M. Abdel Salam, "Developing New Inflow Performance Relationship Correlation for Solution Gas Drive Reservoirs Using Non-Parametric Regression Technique", Master Thesis, Cairo University, Giza, Egypt, 2008.].
Different attempts afterwards were used to either give theoretical explanations of the above IPR correlations or to introduce modifications to the above IPR correlations. Examples of these attempts are as follows:
In 2007, Haiquan et al. [16Z. Haiquan, L. Yingchuan, W. Yulian, L. Chengjian, and L. Wei, "A New General Formula for Dimensionless Well Inflow Performance Relationship", In: SPE Asia Pacific Oil and Gas Conference and Exhibition, Jakarta, Indonesia, 30 October-1 November, 2007. ] deduced a dimensionless IPR for a single phase (oil or gas), based on the nonlinear flow mathematical model developed by Forcheimer. This IPR for solution gas-drive reservoirs (Pr ≤ Pb) as well as partial solution gas- drive reservoirs (Pr ≥ Pb and Pwf ≤ Pb), developed by recognizing the similarity of deliverability equations between laminar flow and nonlinear (turbulent) flow of a single phase, and a general dimensionless IPR formula is gained by summing up and normalizing the IPRs in different cases as shown below where the characteristic parameters (a) and (n) have explicit physical significance.
 |
(2) |
The parameter (n) describes the average extent of solution gas-drive. If n = 1, Eq. 2 is the dimensionless IPR for single phase oil flow (without solution gas-drive); n=2, dimensionless IPR for single phase gas flow or oil flow by solution gas-drive; and 1<n<2, dimensionless IPR for partial solution gas-drive. The parameter (a) describes the type of flow where for a=1, the flow is considered of laminar flow.
Ilk et al. [17D. Ilk, R. Camacho Velazquez, and T. Blasingame, "Inflow Performance Relationship (IPR) for Solution-Gas-Drive Reservoirs: Analytical Considerations", SPE Annual Technical Conference and Exhibition, 2007 Anaheim, California
[http://dx.doi.org/10.2118/110821-MS] ] provided the analytical development of “Vogel”-type Inflow Performance Relationship correlations for solution gas-drive reservoir systems by proposing a characteristic mobility function that extended Del Castillo and Archer et al. [13Y. Del Castillo, "New Inflow Performance Relationships for Gas Condensate Reservoirs", M.S. Thesis, College Station, TX, Texas A & M University, May 2003., 14R.A. Archer, Y. Del Castillo, and T. Blasingame, "New Perspectives on Vogel Type IPR Models for Gas Condensate and Solution-Gas Drive Systems", SPE Production Operations Symposium, 2003 Oklahoma, OK
[http://dx.doi.org/10.2118/80907-MS] ] work for assuming a polynomial mobility profile rather than the linear profile.
In 2009, Jahanbani and Shadizadeh [18A. Jahanbani, and S.R. Shadizadeh, "Determination of Inflow Performance Relationship (IPR) by Well Testing", Canadian International Petroleum Conference (CIPC), 2009 Calgary, Alberta
[http://dx.doi.org/10.2118/2009-086] ] presented analytical solution for determination of IPR curves of oil wells below the bubble point pressure. This approach uses the results of well test analysis along with relative permeability and PVT data using the analytically derived flow equation in both transient and pseudo steady state.
Elias et al. [19M. Elias, A. El-banbi, K.A. Fattah, and E. El-Tayeb, "New Inflow Performance Relationship for Solution Gas-Drive Oil Reservoirs", SPE Annual Technical Conference and Exhibition, 2009 New Orleans, Louisiana
[http://dx.doi.org/10.2118/124041-MS] ] extended the Del Castillo and Archer et al. [13Y. Del Castillo, "New Inflow Performance Relationships for Gas Condensate Reservoirs", M.S. Thesis, College Station, TX, Texas A & M University, May 2003., 14R.A. Archer, Y. Del Castillo, and T. Blasingame, "New Perspectives on Vogel Type IPR Models for Gas Condensate and Solution-Gas Drive Systems", SPE Production Operations Symposium, 2003 Oklahoma, OK
[http://dx.doi.org/10.2118/80907-MS] ] mobility equation as function of pressure and generated an empirical mobility ratio equation based on 47 field cases.
In 2012, Khasanov et al. [20M. Khasanov, V. Krasnov, R. Khabibullin, and T. Musabirov, "Self Consistent Approach to Construct Inflow Performance Relationship for Oil Well", SPE Russian Oil and Gas Exploration and Production Technical Conference and Exhibition, 2012 Moscow, Russia] studied the effect of change in relative permeability and hence the mobility on the shape of the IPR using single well reservoir simulation models. They showed that Fetkovich Equation can be a good representation of the deliverability equation especially in the transition zone where the Pwf is slightly lower than the Pb and the shape of Krg is not increasing sharply with increase in gas saturation. Khasanov et al. [20M. Khasanov, V. Krasnov, R. Khabibullin, and T. Musabirov, "Self Consistent Approach to Construct Inflow Performance Relationship for Oil Well", SPE Russian Oil and Gas Exploration and Production Technical Conference and Exhibition, 2012 Moscow, Russia] proposed a generic IPR correlation close to Fetkovich equation as follows:
 |
(3) |
Where mk ranges from 1.4 to 2 with value of 2 being noticed when the Pwf is close to Pb and Krg is not increasing sharply with increase in gas saturation with Krg max value being less than 0.05. The nk values range from 0.75 to 1 with low values occurring in the transition zone during the depletion process where the Pwf is slightly lower than the Pb with low gas saturation and nk value tends to be1 when the reservoir pressure and the Pwf are far below the Pb.
Through time IPR curves have used in different applications, Brown [21K.E. Brown, "Overview of Artificial Lift Systems", J. Pet. Technol., vol. 34, pp. 2384-2396, 1982.
[http://dx.doi.org/10.2118/9979-PA] ] in 1982 used IPR combined with tubing intake curves to provide an optimum artificial lift method to produce the well. In 1988, Avery and Evans [22D.J. Avery, and R.D. Evans, "Design Optimization of Plunger Lift System", Tianjin, China, 1988.
[http://dx.doi.org/10.2118/17585-MS] ] utilize IPR curves in examining the well performance under different artificial lift designs. IPR curves were also used during enhanced oil recovery process where Yeu et al. [23X. Yu, H. Xia, Y. Zhang, and J. Li, "Calculation of IPR Curves of Oil Wells for Polymer Flooding Reservoirs", SPE Annual Technical Conference and Exhibition, 1997 San Antonio, Texas
[http://dx.doi.org/10.2118/38936-MS] ] in 1997 used IPR to predict the performance of an oil well under the implementation of polymer flooding. After emerging of the multi-lateral technology, Guo et al. [24B. Guo, K. Ling, and A. Ghalambor, "A rigorous Composite-IPR for Multi-Lateral Wells", SPE Annual Technical Conference and Exhibition, 2006 San Antonio, Texas
[http://dx.doi.org/10.2118/100923-MS] ] in 2006 derived composite IPR for multi-lateral wells. These are few of the many applications of IPR in oil industry.
Most of the IPR correlations suffer from common limitations that they are not explicitly function of the different reservoir rock and fluid properties that vary from one reservoir to another or its difficulty to be applied. This will affect the accuracy of the correlations especially if the reservoir properties of the well under study are completely different from the properties used in generating these correlations. In this work, a single well 3D radial reservoir model with solution gas-drive as the main driving mechanism was built and reservoir simulation was used to generate different IPRs by changing the reservoir rock and fluid properties. The most sensitive reservoir rock and fluid properties were selected to generate the new IPR correlation. This new correlation is based on generating 550 combination of the selected reservoir rock and fluid properties and run the simulation models to generate different 550 IPR curves. Then, the non-parametric regression technique was used to generate the new IPR correlation that is explicitly function of the reservoir rock and fluid properties that highly affect the IPR curve.
The outline of the paper is as follows. Firstly, we presented the assumptions we used in generating the single well reservoir simulation model. Secondly, we studied the sensitivity of the IPR towards different rock and fluid parameters to choose the highly sensitive parameters to be used in the IPR correlation. Thirdly, we presented the nonlinear and non-parametric regression techniques we used to develop the IPR correlation that is explicitly function of reservoir rock and fluid properties. Finally, we presented the validation of the new correlation based on different synthetic and field cases.
2. MODEL CONSTRUCTION
MORE [25 Roxar, “MORE Manual - Version 6.3, 2006.] that stands for Modular Oil Reservoir Evaluation was used to simulate the multi-rate test for constructing the IPR curve. The reservoir simulator was used to construct 550 reservoir models that cover a wide range of rock and fluid properties. These different reservoir models were used to examine the sensitivity of IPR curve towards the change in the reservoir rock and fluid properties, to select the highly sensitive properties for developing the IPR correlation. It is important to mention here that in constructing the single well reservoir simulation model, all the points on the IPR curve were in the pseudo-steady flow period with constant rate at the inner boundary and no flow at the outer boundary with two phases flowing which were oil and gas. The general assumptions used in building the reservoir models can be summarized as follows:
- 3D radial flow into the well bore as shown in Fig. (1
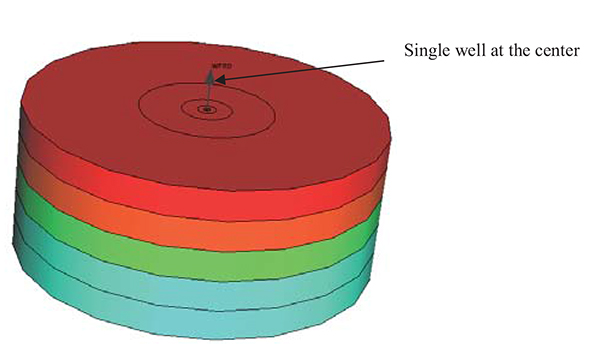 ).
).
- The reservoir initially at the bubble point pressure
- Vertical well at the center of the formation.
- The well is completed through the whole formation thickness.
- Homogeneous, bounded reservoir (Pseudo steady state flow period).
- Isothermal conditions exist
- Two Phase Flow (Oil & Gas).
- Capillary pressure is neglected
 |
Fig. (1) 3D radial Model. |
3. SENSITIVITY ANALYSIS
The sensitivity analysis is performed to examine the effect of different reservoir rock and fluid properties on the IPR behavior and hence selecting the highly sensitive parameters to be used in generating the IPR correlation.
Table (1) gives the range of reservoir rock and fluid properties used in this study. In the sensitivity analysis, one parameter was changed at a time while the rest was kept at its base value to be able to identify the sensitive parameters to the shape of the IPR curve.
Different rock and fluid properties are included in this study and the following list gives the properties that were found to have major effect on the IPR behavior using both IPR and dimensionless IPR plots:
- Bubble Point Pressure, Pb
- Reservoir Depletion Ratio (Pr/Pb)
- Critical Gas Saturation, Sgcr
- Residual Oil Saturation in Gas, Sorg
- Relative Permeability to Oil at Swcr, Krow at (Swcr)
- Relative Permeability to Gas at (1-Swcr-Sorg), Krg at (1-Swcr-Sorg)
- Oil-Gas Relative Permeability Exponent, OGEXP
- Gas Relative Permeability Exponent, GEXP
- Skin, S
Figs. (2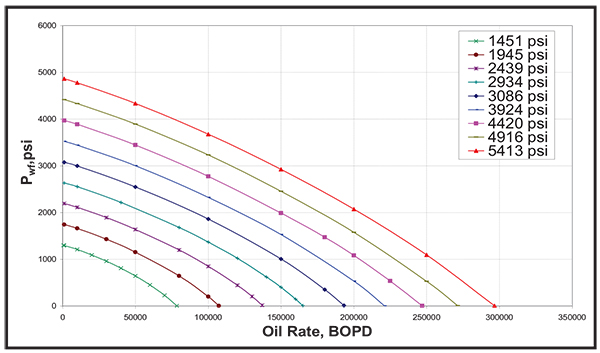 to 19
to 19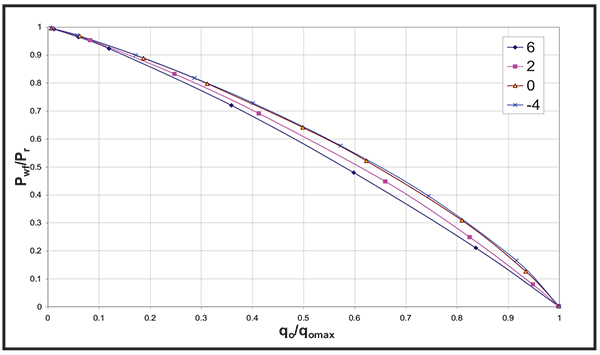 ) show the IPR and dimensionless IPR behavior under the effect of the above mentioned rock and fluid properties that affect the IPR.
 |
Fig. (2) Effect of Bubble Point Pressure on the IPR curve. |
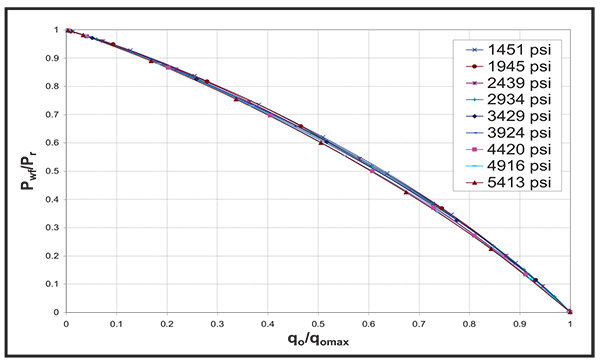 |
Fig. (3) Effect of Bubble Point Pressure on the dimensionless IPR curve. |
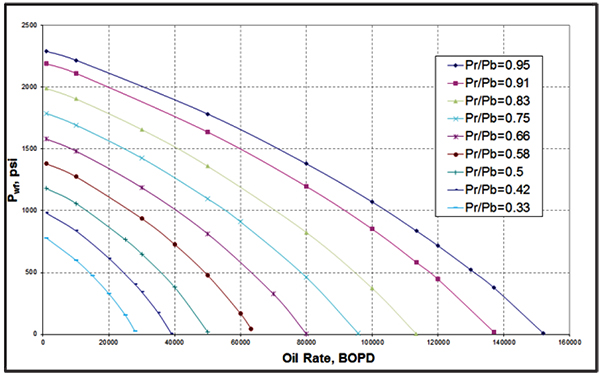 |
Fig. (4) Effect of Reservoir Pressure Depletion on the IPR curve. |
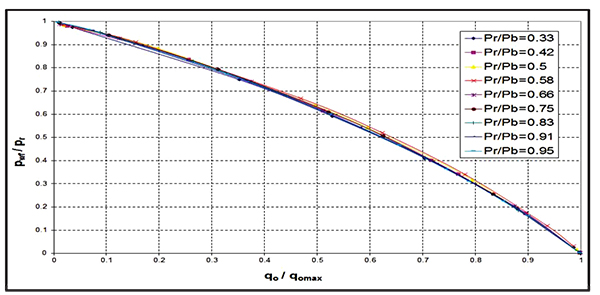 |
Fig. (5) Effect of Reservoir Pressure Depletion on the dimensionless IPR curve. |
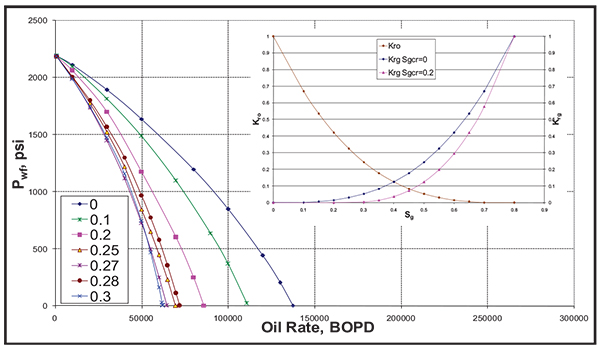 |
Fig. (6) Effect of Sgcr on the IPR curve. |
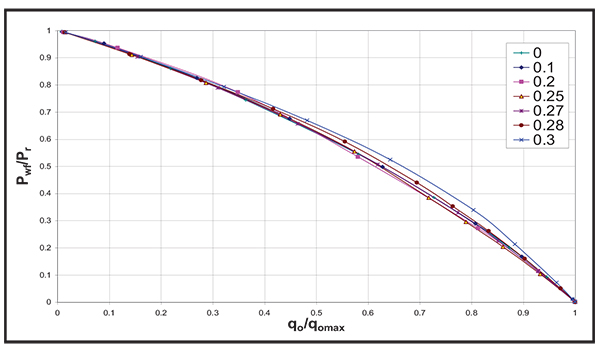 |
Fig. (7) Effect of Sgcr on the dimensionless IPR curve. |
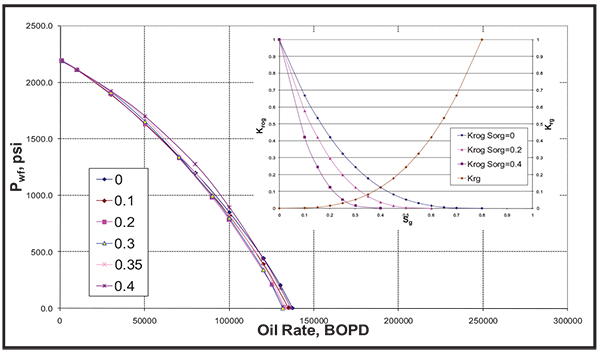 |
Fig. (8) Effect of Sorg on the IPR curve. |
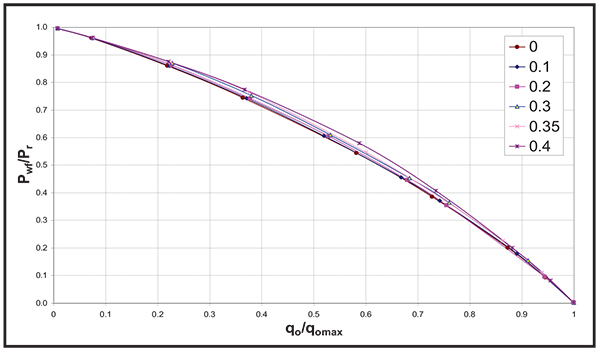 |
Fig. (9) Effect of Sorg on the dimensionless IPR curve. |
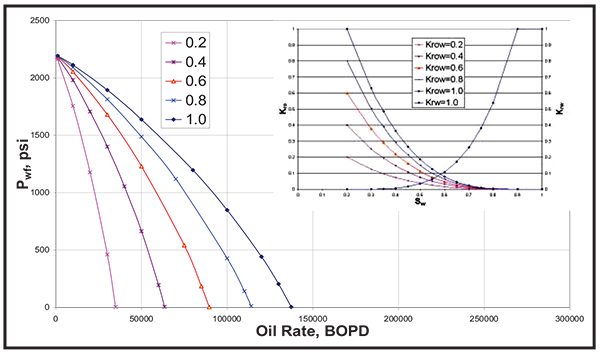 |
Fig. (10) Effect of Krow at (Swcr) on the IPR curve. |
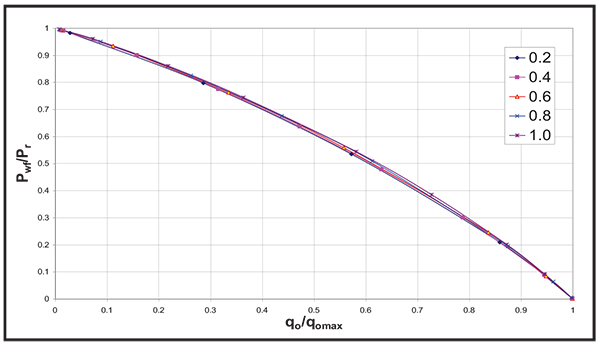 |
Fig. (11) Effect of Krow at (Swcr) on the dimensionless IPR curve. |
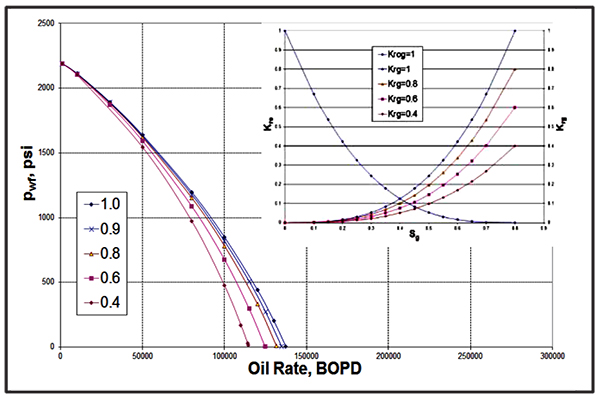 |
Fig. (12) Effect of Krg at (1-Swcr-Sorg) on the IPR curve. |
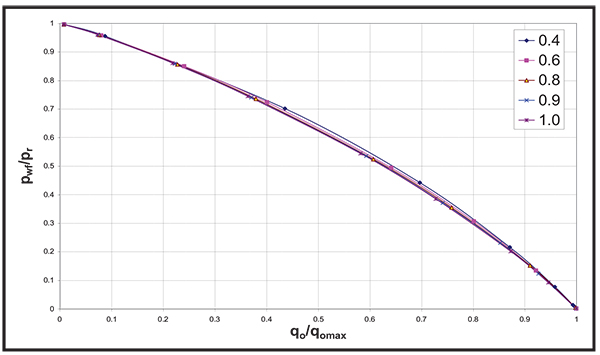 |
Fig. (13) Effect of Krg at (1-Swcr-Sorg) on the dimensionless IPR curve. |
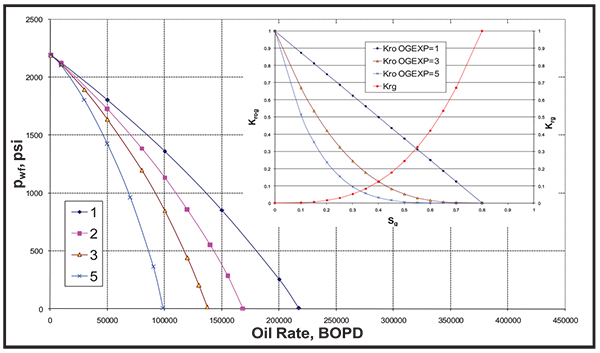 |
Fig. (14) Effect of OG Exponent on the IPR curve. |
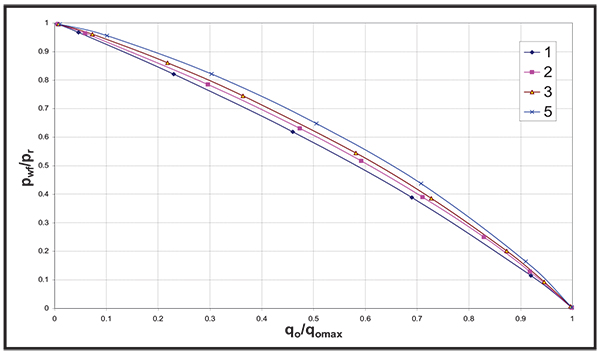 |
Fig. (15) Effect of OG Exponent on the dimensionless IPR curve. |
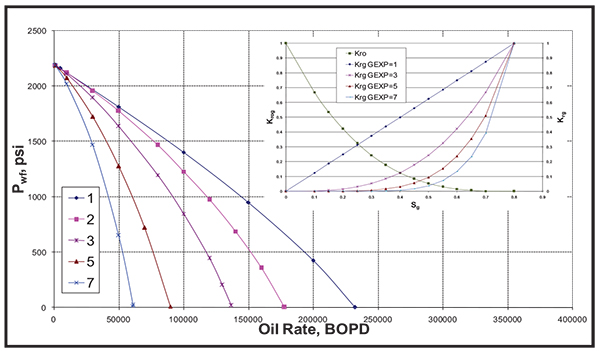 |
Fig. (16) Effect of Gas Exponent on the IPR curve. |
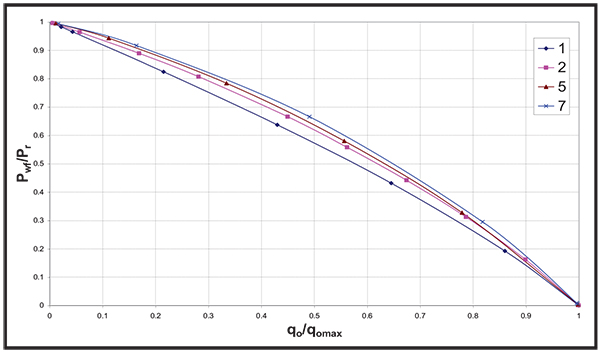 |
Fig. (17) Effect of Gas Exponent on the dimensionless IPR curve. |
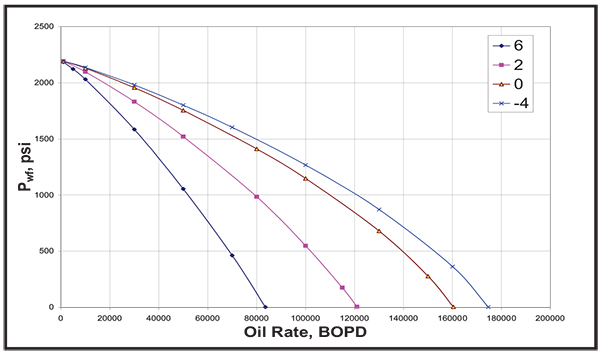 |
Fig. (18) Effect of Skin on the IPR curve. |
 |
Fig. (19) Effect of Skin on the dimensionless IPR curve. |
The IPR and the dimensionless IPR performance was found insensitive to all the parameters that are mainly affecting the water flow in the reservoir, as the assumption used in this study is solution gas- drive reservoir with minimum water flow. This is in addition to the other parameters that has less effect on the oil and gas flow.
3.1. The following list gives the properties that found did not affect the IPR behavior:
- Water Gravity, γW
- Water Viscosity, µW
- Critical water saturation, Swcr
- Residual oil saturation in Water, Sorw
- Relative permeability to water at Sorw, Krw at (Sorw)
- Oil-Water relative permeability exponent, OWEXP
- Water relative permeability exponent, WEXP
- Porosity
3.2. The following list gives the properties that found did not affect the dimensionless IPR behavior:
- Temperature
- Oil gravity
- Gas gravity
- Vertical permeability
- Horizontal permeability
- Drainage radius
- Formation thickness
3.3. Non-Parametric Regression Analysis
550 IPRs were generated from the combination of the 9 sensitive parameters identified from the sensitivity analysis using simulation models. This was followed by implementing the non-linear regression technique to get the distinct parameter (C1) that represents each IPR based on Vogel [4J.V. Vogel, "Inflow Performance Relationships for Solution Gas-Drive Wells", J. Pet. Technol., vol. 20, pp. 83-92, 1968.
[http://dx.doi.org/10.2118/1476-PA] ] and Richardson and Shaw [7J.M. Richardson, and A.H. Shaw, "Two-Rate IPR Testing — A Practical Production Tool", J. Can. Pet. Technol., vol. 21, pp. 57-61, 1982.
[http://dx.doi.org/10.2118/82-02-01] ] correlations as shown below in Eq. 4:
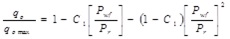 |
(4) |
The generated values for C1 corresponding to the 550 combinations of different rock and fluid properties represent the database used in generating the new IPR correlation.
In order to generate IPR correlation that is explicitly function of the different reservoir rock and fluid properties, we need to build a correlation between the C1 (dependent variables) given in Eq. 4 and the 9 sensitive rock and fluid properties (independent variables) presented before. Since the formula that relates the dependent and independent variables is not known so parametric regression analysis cannot be implemented here which leads to the implementation of non-parametric regression analysis in our work. Neural Network modeling can be considered as one of the non-parametric modeling approaches and has wide range of applications in oil industry. However, the method that was used here is based on the Alternating Conditional Expectation (ACE) algorithm [26L. Breiman, and J.H. Friedman, "Estimating Optimal Transformations for multiple Regression and Correlation", J. Am. Stat. Assoc., vol. 80, pp. 580-598, 1985.
[http://dx.doi.org/10.1080/01621459.1985.10478157] , 27G. Xue, A. Datta-Gupta, P. Valko, and T.A. Blasingame, "Optimal Transformations for Multiple Regression: Application to Permeability Estimation from Well Logs", SPE Formation Evaluation Journal, vol. 12, pp. 85-93, 1997.
[http://dx.doi.org/10.2118/35412-PA] ]. A comparison between Neural Network and ACE algorithm was used to build bubble point pressure correlation for oil reservoirs [28W.D. Mc Cain Jr, R.B. Soto, P.P. Valko, and T.A. Blasingame, "Correlation of Bubble Point Pressures for Reservoir Oils – A Comparative Study", In: SPE Eastern Regional Conference and Exhibition, 1998 pp. 267-275 Pittsburgh, PA.] and it was found that the predictive strength of ACE is much higher compared to Neural Network for the studied samples. The ACE algorithm is based on the concept of developing non-parametric transformations of the dependent and independent variables. Moreover, the transformations are constructed point wise based only on the data without the need to know a prior function between the dependent and independent variables. The final correlation is given by plotting the transformed dependent variable against the sum of the transformed independent variables. The final result is a maximum correlation between the dependent and multiple independent variables with a minimum error. Fig. (20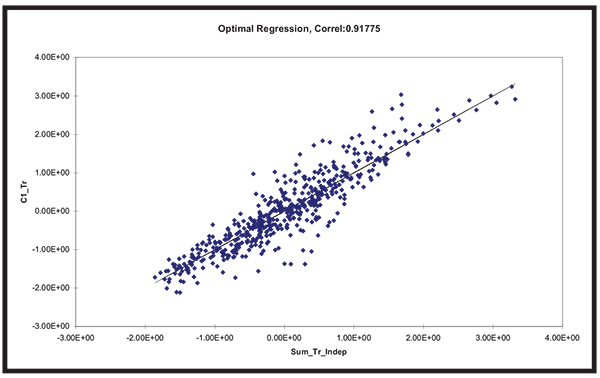 ) shows the relationship between the transformed dependent variable C1 versus the sum of the transformed independent variables that gives the highest correlation coefficient. The optimal regression correlation here is 0.91775 as shown in Fig. (20).
 |
Fig. (20) Transformed dependent variable vs. sum of the transformed independent variables. |
The 550 several combinations of the 9 sensitive parameters which represent the independent variables with one dependent variable that is C1 were used in the ACE Algorithm [27G. Xue, A. Datta-Gupta, P. Valko, and T.A. Blasingame, "Optimal Transformations for Multiple Regression: Application to Permeability Estimation from Well Logs", SPE Formation Evaluation Journal, vol. 12, pp. 85-93, 1997.
[http://dx.doi.org/10.2118/35412-PA] ] to find the best correlation between the dependent and the independent variables. The resulted IPR correlation is given in Eq. 4 with C1 as explicit polynomial function of different reservoir rock and fluid properties which is given as follows:
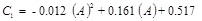 |
(5) |
Where, the independent variable (A) is given as:
 |
 |
(6) |
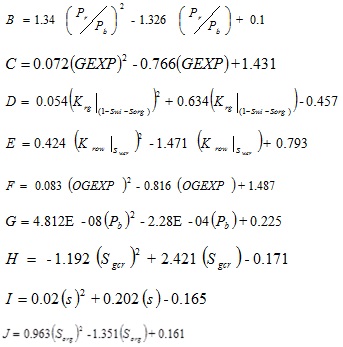
Fig. (21 ) shows the comparison between the calculated and measured C1 distinct IPR parameter from our reservoir parameters data base used in building the IPR correlation. This reflects the good accuracy of the correlation to accurately predict the IPR performance within our data base. At the same time, the variation of C1 from 0 to 1 reflects that the selected reservoir parameters used in building the IPR correlation cover wide range of reservoir rock and fluid properties which increase the range of application of the proposed IPR correlation compared to C1 of 0.2 used by Vogel [4J.V. Vogel, "Inflow Performance Relationships for Solution Gas-Drive Wells", J. Pet. Technol., vol. 20, pp. 83-92, 1968.
[http://dx.doi.org/10.2118/1476-PA] ] correlation.
 |
Fig. (21) C1 comparison; simulation versus proposed correlation for the data base cases. |
4. VALIDATION
4.1. Synthetic Cases
In order to test the performance of our proposed IPR correlation in accurately predicting the IPR performance, we generated nine different combinations of reservoir rock and fluid properties which are different from those used in our data base used in building the correlation, and then we used reservoir simulation model to generate the IPRs for these 9 different combinations. We used our proposed correlation with the nine different reservoir rock and fluid properties to estimate the distinct IPR parameter C1 which is then used to get the IPR performance per each reservoir and compare it with the actual IPR generated from the reservoir simulation. The proposed IPR correlation was able to successfully predict the true IPR with the least error compared to the other IPR models within errors range from 2.0 to 2.4%. Fig. (22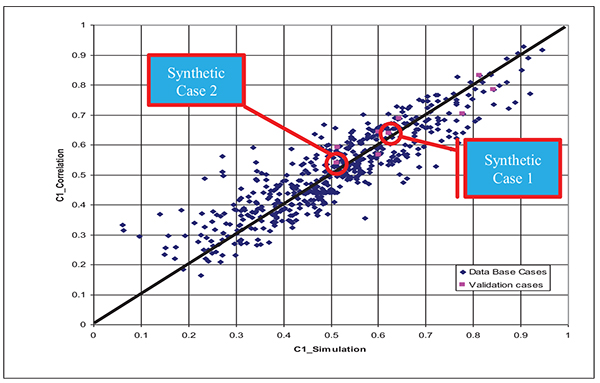 ) shows the comparison between the actual C1 generated from the reservoir simulation models with that calculated from the proposed IPR correlation from the data base cases and the nine validation cases (points in pink color). In addition, Figs. (23a
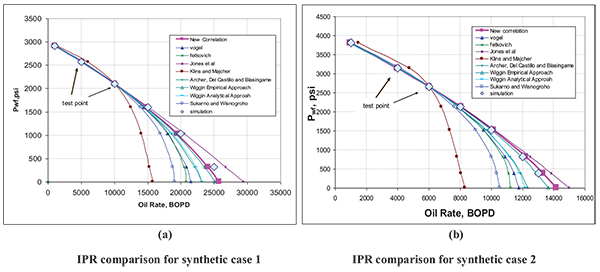 and b) and Tables (2a and b) give the IPR comparison from 2 out of the 9 validation cases which show 2.4 and 2.3% error respectively. As observed from Figs. (23a, and b) and Table (2a and b) our proposed correlation was able to accurately predict the IPR performance within an acceptable accuracy compared to the other correlations. In all these synthetic cases, the multi rate test data was taken at high draw down that can reach to more than 90% of the reservoir pressure which is practically difficult to be done in the field cases as will be shown later.
 |
Fig. (22) Comparison of C1 from the simulation models and the proposed correlation for the 550 data base cases and 9 synthetic cases. |
 |
Fig. (23) IPR comparison of two validation cases from the proposed correlation compared to actual generated from simulation and other commonly used IPR correlations. |
4.2. Field Cases
Three different field cases from different solution gas-drive fields worldwide were used to test the practical application of the proposed correlation compared to the other widely used correlations in accurately predicting the multi-rate test data. The major difficulties noticed in these field cases are that, most of the multi rate tests taken from wells especially in solution gas-drive reservoirs were obtained with minimum range of draw down as it is practically difficult to design multi rate tests for wells with high drawdown. On the contrary, for the synthetic cases shown above, we have tendency to reach very high drawdown where the bottom hole flowing pressure can reach to extremely low values as shown in Figs. (23a and b) where one is able to test the performance of different correlations at low and high drawdown conditions for better judgement. This problem in most of the multi-rate test data of all the field cases leads to the difficulty in assessing the effectiveness of our proposed correlation compared to the other correlations as all of the correlations give acceptable results at low range of drawdowns which will be observed in the next section of the field cases discussion.
4.2.1. Field Case 1: Well 6, Field A [5M.J. Fetkovich, "The Isochronal Testing of Oil Wells", In: SPE Annual Meeting, September 30-October 3, Las Vegas, NV, 1973.
[http://dx.doi.org/10.2118/4529-MS] , 29F. Gallice, "A Comparison of Two-Phase Inflow Performance Relationships", M.S. thesis, University of Oklahoma, Norman, Oklahoma, 1997.]
Field A is solution gas-drive carbonate reservoir; the average gas saturation at the time of the tests was between 10 and 12%. The reservoir was above the critical gas saturation at the time of the tests. The rock and fluid properties and the C1 IPR distinct parameters calculated from the proposed correlation are given in Table (3).
The test consists of seven individual flows, the first four flow rates were run in a normal increasing sequence followed by reducing rate and then increasing rate. Table (4) shows the multi-rate test data taken from this well.
Fig. (24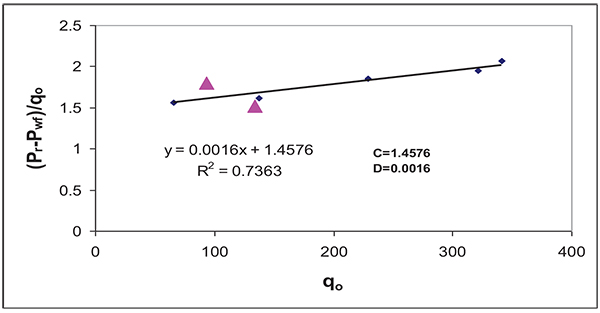 ) gives Jones et al. plot for this field case. It seems that two out of the seven test points (Pwf=1178 psi & Pwf=1142 psi) lied out of the straight line trend and it showed that there is an error for these measured points and it must be excluded from using them as test points for the IPR construction. Fig. (25
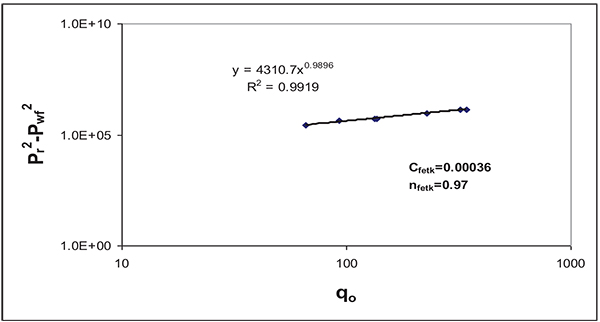 ) gives Fetkovich plot for same field case.
Table (5) shows the flow rates estimated for this case for the proposed and commonly used IPR correlations using test point at a flowing bottom hole pressure of 921 psi, representing 32% drawdown for all the correlations with additional one test point for Fetkovich and Jones et al. correlation. As can be seen, the absolute open flow potential (AOF) varies from 420 to 552 BOPD from the different correlations. The largest flow was calculated with Jones et al. correlation, while the smallest one was obtained using Sukarno et al. correlation.
Fig. (26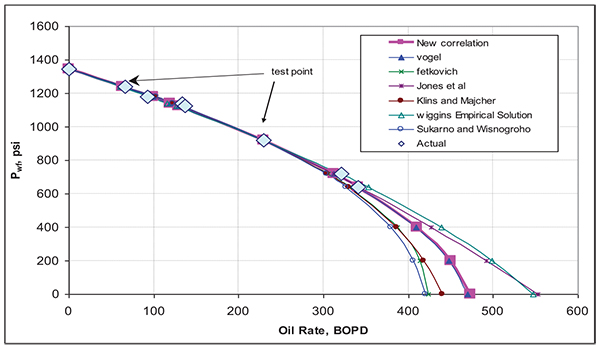 ) gives the proposed correlation compared to the other correlations. The average absolute errors between the recorded flow rate data and the estimated rates as shown in Table (5) was 5% for the proposed correlation, Vogel, Jones et al., Sukarno et al. and Klins and Majcher correlations while it was 6% for Wiggins Empirical correlation [8M.L. Wiggins, "Inflow Performance of Oil Wells Producing Water", Ph.D. dissertation, College Station, TX, Texas A&M University, 1991., 9M.L. Wiggins, "Generalized Inflow Performance Relationships for Three-Phase flow", SPE Production Operations Symposium Oklahoma City : 1993, March 21-23.
[http://dx.doi.org/10.2118/25458-MS] ] and Fetkovich. The proposed correlation was able to accurately predict the multi-rate test data within a reasonable accuracy compared to the other correlations with all the correlations showing almost same average absolute errors due the small drawdowns of all the test points.
 |
Fig. (24) Jones et al. plot for field case 1. |

 |
Fig. (25) Fetkovich plot for field case 1. |

 |
Fig. (26) IPR comparison for field case 1. |
4.2.2. Field case 2: Well B, Keokuk Pool, Seminole County, Oklahoma, December 1934 [29F. Gallice, "A Comparison of Two-Phase Inflow Performance Relationships", M.S. thesis, University of Oklahoma, Norman, Oklahoma, 1997.]
Table (6) gives the reservoir properties and the C1 estimate for this field case. Table (7) shows the multi-rate test data taken from this case. Table (8) shows the flow rates estimated for this case for the proposed and commonly used IPR correlations using test point at a flowing bottom hole pressure of 1196 psi, representing 30% drawdown and another test point at a flowing bottom hole pressure of 1443 psi, representing 16% drawdown for Fetkovich and Jones et al. correlation. The absolute open flow potential (AOF) varies from 2034 to 2870 BOPD. The largest AOF was calculated from Fetkovich while the smallest one was obtained from Klins and Majcher correlation.
Fig. (27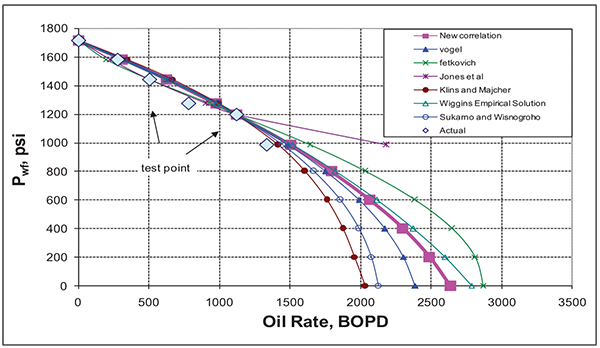 ) gives the proposed correlation compared to the other correlations. The average absolute errors between the recorded flow rate data and the estimated rates was 18% for the proposed correlation and Wiggins Empirical correlation [8M.L. Wiggins, "Inflow Performance of Oil Wells Producing Water", Ph.D. dissertation, College Station, TX, Texas A&M University, 1991., 9M.L. Wiggins, "Generalized Inflow Performance Relationships for Three-Phase flow", SPE Production Operations Symposium Oklahoma City : 1993, March 21-23.
[http://dx.doi.org/10.2118/25458-MS] ], 19% for Vogel, 20% for Sukarno et al., 23% for Klins and Majcher, 24% for Fetkovich, 33% for Jones et al. correlation. The proposed correlation gives the reasonable error compared to the other correlations used in this case with highest error obtained from the two-point tests which are Fetkovich and Jones et al. correlations. All the single-point test correlations including the proposed correlations show almost the same average absolute error due to the low drawdowns of the test points as mentioned in the previous field case.
 |
Fig. (27) IPR comparison for field case 2. |
4.2.3. Field case 3: Well B, Keokuk Pool, Seminole County, Oklahoma, August 1935 [29F. Gallice, "A Comparison of Two-Phase Inflow Performance Relationships", M.S. thesis, University of Oklahoma, Norman, Oklahoma, 1997.]
The multi rate test has been repeated for this well from Field Case 2 after 8 months of production with a drop in reservoir pressure from 1714 psi to 1605 psi. Table (9) gives the reservoir properties and the C1 estimate for this field. Table (10) shows the multi-rate test data taken from this well. Table (11) gives the flow rates estimated for this case for the proposed and commonly used IPR correlations using test point at a flowing bottom hole pressure of 1231 psi, representing 23% drawdown and another test point at a flowing bottom hole pressure of 1381 psi, representing 14% drawdown for Fetkovich and Jones et al. correlation. As can be seen, the Absolute Open Flow potential (AOF) varies from 1618 to 4907 BOPD. The largest AOF was calculated from Jones et al. correlation, while the smallest one was obtained from Klins and Majcher correlation.
Fig. (28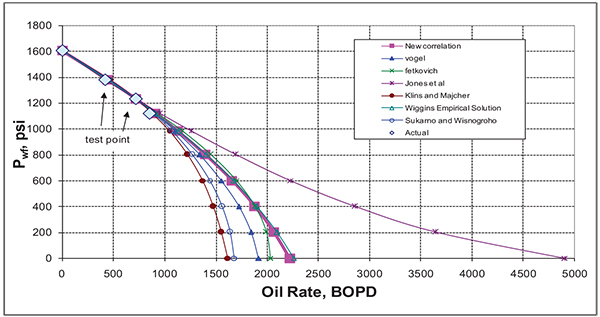 ) gives the proposed correlation compared to the other correlations. The average absolute errors between the recorded flow rate data and the estimated rates was 7% for the proposed correlation, Vogel, Wiggins Empirical correlation, Sukarno et al., and Klins and Majcher while it was 10% for Fetkovich, 12% for Jones et al. correlation.


 |
Fig. (28) IPR comparison for field case 3. |
This case represents a good opportunity to examine the behavior of the proposed correlation in predicting the future IPR using Eickmeier [30J. R. Eickmeier, "How to Accurately Predict Future Well Productivities", World Oil, 1968.] Equation compared to the other correlations. Eickmeier equation as shown below is used to predict maximum oil rate by knowing the predicted reservoir pressure:
 |
(7) |
The IPR prediction using Fetkovich is based on assuming constant values for nfetk, Cfetk. Case 2 and 3 show minor differences in these values so the assumption of using these values as constant during prediction is valid in this case only.
Table (12) shows the predicted flow rates for field case 3 using data from case 2 for the proposed and the other commonly used correlations. As can be seen, the absolute open flow potential (AOF) varies from 1670 to 2357 BOPD. The largest AOF was calculated from Fetkovich while the smallest one was obtained from Klins and Majcher. Fig. (29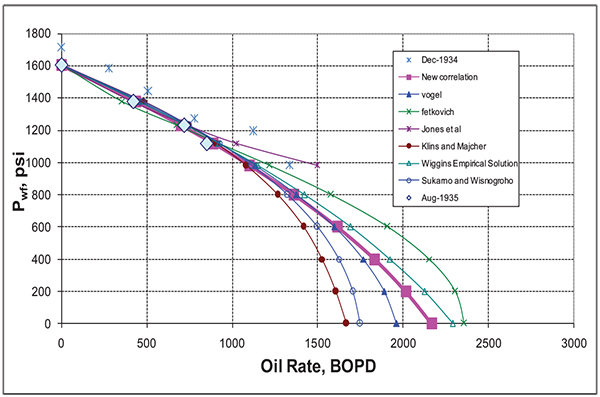 ) gives the proposed correlation compared to the other correlations. The average absolute errors between the recorded flow rate data and the estimated rates was 3% for the proposed correlation, 6% for Wiggins Empirical correlation, 7% for Vogel, 8% for Klins and Majcher, 9% for Sukarno et al., and Jones et al. and 10% for Fetkovich. The proposed correlation gives the least error compared to the other correlations during the prediction which indicates the reasonable accuracy of the proposed correlation in predicting the future IPR.
Field cases 2 & 3 present good real field examples to examine the prediction of future IPR using Eickmeier [30J. R. Eickmeier, "How to Accurately Predict Future Well Productivities", World Oil, 1968.] Equation. The results showed that using constant values for Fetkovich and Jones et al. during predicting the future IPR might not be a good assumption in some cases. The proposed correlation that depends on only single-point test shows its good accuracy in predicting the future IPR compared to all the other correlations as seen from Table (12).
 |
Fig. (29) Future IPR comparison for field case 3. |
As shown from the above field cases, variety of field cases with different reservoir rock and fluid properties were presented. Jones at al. Correlation failed to predict the IPR to the AOF for field case 2 due to having a negative turbulent flow coefficient (D), which resulted in calculating unreal value for the flow rates at low bottom hole flowing pressure. This limits the practical application of Jones et al. correlation.
SUMMARY AND CONCLUSION
Following conclusions can be drawn:
- All the IPR correlations which are widely used to predict the deliverability of wells produced from solution gas-drive reservoirs suffer from one common limitation that they are not explicitly function of the different reservoir rock and fluid properties that vary from one reservoir to another. Thus, none of the correlations could be considered as the best method over a wide range of reservoir conditions. One may provide the best estimation for a particular case, while providing the worst for some other cases.
- The proposed correlation and Vogel correlation used the same base equation with the main difference that Vogel uses a constant distinct C1 value of 0.2 while for the proposed correlation, the distinct C1 value varies depending on reservoir rock and fluid properties which could vary from one reservoir to another. It was shown in the 550 generated reservoir cases that C1 distinct values can range from 0.1 to 0.9. This expands the range of application of the proposed correlation compared to the others.
- The proposed correlation showed good accuracy compared to the other widely used correlations in predicting the true multi-rate test data as shown in the different synthetic and field cases presented in this work. The synthetic cases which reached to drawdown of almost 99% showed that the proposed correlation gives less error compared to the other correlations especially compared to Vogel correlation as both use the same equation with only difference in the distinct C1 value used in both. For the field cases due to the practical difficulty of the field cases to have test points at higher draw down (the maximum drawdown used was 30% of the reservoir pressure), so the effectiveness of the proposed model compared to the rest of the models cannot be assessed properly at very low pressure (high draw down). However, the proposed correlation did not show any severe discrepancy compared to the other correlations in predicting the wells deliverability.
- The proposed correlation was also examined for predicting the future IPR as shown in the Field cases 2 and 3 and the results show its good accuracy compared to all the other correlations. This is in addition to the failure of Fetkovich and Jones et al. to predict accurately the IPR in some of the cases due to the assumption of using constant values of Fetkovich and Jones et al. parameters during prediction.
- The most important feature of the proposed correlation is its dependency on many reservoir rock and fluid properties that proved to highly affect the IPR modeling in solution gas-drive reservoirs based on the sensitivity study done in this work. This will allow the user to use all the available data to accurately predict the IPR performance rather than using any of the current empirical correlation that depends on specific reservoir rock and fluid properties or the analytical correlation that is rather difficult to be applied or does not cover a wide range of reservoir data.
NOMENCLATURE
| γ 0 | = Oil gravity |
| γw | = Water gravity |
| γg | = Gas gravity |
| µ 0 | = Oil viscosity, cp |
| µW | = Water viscosity, cp |
| Bo | = Oil formation volume factor, bbl/stb |
| C | = Jones et al. laminar-flow coefficient, psi/stb/day |
| Cfetk | = Fetkovich productivity index of the reservoir (PI), stb/day/psi2n |
| D | = Jones et al. turbulence coefficient, psi/ (stb/day)2 |
| GEXP | = Gas relative permeability exponent that affects the curvature of Krg |
| h | = Formation thickness, ft |
| J | = Productivity index of the reservoir, bbl/day/psi |
| Kh | = Horizontal permeability, md |
| Krg at (1-Swcr-Sorg) | = Relative permeability to gas at (1-Swcr-Sorg), fraction |
| Kro | = Oil relative permeability, fraction |
| Krow at (Swcr) | = Relative permeability to oil at Swcr, fraction |
| Krw at (Sorw) | = Relative permeability to water at Sorw, fraction |
| Kv | = Vertical permeability, md |
| mk | = Khasanov et al. exponent |
| nfetk | = Fetkovich flow exponent |
| nk | = Khasanov et al. exponent |
| OGEXP | = Oil-Gas relative permeability exponent that affects the curvature of Krog |
| OWEXP | = Oil-Water relative permeability exponent that affects the curvature of Krow |
| Pb | = Bubble Point Pressure, psi |
| Pe | = Pressure at the outer boundary, psi |
| Pr | = Average reservoir pressure, psi |
| Pr1, Pr2 | = Average reservoir pressure at the current and predicted IPR correlation, respectively, psi |
| Pwf | = Bottom hole flowing pressure, psi |
| qo | = Oil flow rate, bbl/day |
| qomax | = Maximum oil flow rate, bbl/day |
| qomax1, qomax2 | = Maximum oil flow rate at the current and predicted IPR correlation, respectively, bbl/day |
| re | = Drainage Radius, ft |
| Rs | = Solution Gas Oil Ratio, Mscf/STB |
| rw | = Well radius, ft |
| S | = Skin |
| Sgcr | = Critical gas saturation, fraction |
| Sorg | = Residual oil saturation in gas, fraction |
| Sorw | = Residual oil saturation in water, fraction |
| Swcr | = Critical water saturation, fraction |
| Tr | = Reservoir temperature, F |
| WEXP | = Water relative permeability exponent that affects the curvature of Krw |
| Z | = Gas deviation factor |
ETHICS APPROVAL AND CONSENT TO PARTICIPATE
Not applicable.
CONSENT FOR PUBLICATION
Not applicable.
CONFLICT OF INTEREST
The authors declare no conflict of interest, financial or otherwise.
ACKNOWLEDGEMENT
Declared None.
REFERENCES
| [1] | H.H. Evinger, and M. Muskat, "Calculation of Theoretical Productivity Factors", Trans. Metall. Soc. AIME, vol. 146, pp. 126-139, 1942. [http://dx.doi.org/10.2118/942126-G] |
| [2] | E.L. Rawlins, and M.A. Schellhardt, “Backpressure Data on Natural Gas Wells and Their Application to Production Practices”, Monograph Series 7, U.S. Bureau of Mines., American Gas Association, Lord Baltimore Press, 1935. |
| [3] | W.E. Gilbert, "Flowing and Gas-Lift Well Performance", In: American Petroleum Institute Proceedings, 1954, pp. 126-157. |
| [4] | J.V. Vogel, "Inflow Performance Relationships for Solution Gas-Drive Wells", J. Pet. Technol., vol. 20, pp. 83-92, 1968. [http://dx.doi.org/10.2118/1476-PA] |
| [5] | M.J. Fetkovich, "The Isochronal Testing of Oil Wells", In: SPE Annual Meeting, September 30-October 3, Las Vegas, NV, 1973. [http://dx.doi.org/10.2118/4529-MS] |
| [6] | L.G. Jones, E.M. Blount, and O.H. Glaze, "Use of Short Term Multiple Rate Flow Tests to Predict Performance of Wells Having Turbulence", In: SPE Annual Technical Meeting and Exhibition, Oct. 3-6, New Orleans, 1976. [http://dx.doi.org/10.2118/6133-MS] |
| [7] | J.M. Richardson, and A.H. Shaw, "Two-Rate IPR Testing — A Practical Production Tool", J. Can. Pet. Technol., vol. 21, pp. 57-61, 1982. [http://dx.doi.org/10.2118/82-02-01] |
| [8] | M.L. Wiggins, "Inflow Performance of Oil Wells Producing Water", Ph.D. dissertation, College Station, TX, Texas A&M University, 1991. |
| [9] | M.L. Wiggins, "Generalized Inflow Performance Relationships for Three-Phase flow", SPE Production Operations Symposium Oklahoma City : 1993, March 21-23. [http://dx.doi.org/10.2118/25458-MS] |
| [10] | M.A. Klins, and M.W. Majcher, "Inflow Performance Relationships for Damaged or Improved Wells Producing Under Solution-Gas Drive", J. Pet. Technol., vol. 44, pp. 1357-1363, 1992. [http://dx.doi.org/10.2118/19852-PA] |
| [11] | P. Sukarno, and A. Wisnogroho, "Generalized Two-Phase IPR Curve Equation under Influence of Non-linear Flow Efficiency", In: Society of Indonesian Petroleum Engineers Production Optimization International Symposium Conference Proceeding, Bandung, Indonesia, 1995. |
| [12] | M.L. Wiggins, J.L. Russel, and J.W. Jennings, "Analytical Inflow Performance Relationships for Three Phase Flow in Bounded Reservoirs", In: SPE Western Regional Meeting, March 30-April 1, California, 1992. [http://dx.doi.org/10.2118/24055-MS] |
| [13] | Y. Del Castillo, "New Inflow Performance Relationships for Gas Condensate Reservoirs", M.S. Thesis, College Station, TX, Texas A & M University, May 2003. |
| [14] | R.A. Archer, Y. Del Castillo, and T. Blasingame, "New Perspectives on Vogel Type IPR Models for Gas Condensate and Solution-Gas Drive Systems", SPE Production Operations Symposium, 2003 Oklahoma, OK [http://dx.doi.org/10.2118/80907-MS] |
| [15] | M. Abdel Salam, "Developing New Inflow Performance Relationship Correlation for Solution Gas Drive Reservoirs Using Non-Parametric Regression Technique", Master Thesis, Cairo University, Giza, Egypt, 2008. |
| [16] | Z. Haiquan, L. Yingchuan, W. Yulian, L. Chengjian, and L. Wei, "A New General Formula for Dimensionless Well Inflow Performance Relationship", In: SPE Asia Pacific Oil and Gas Conference and Exhibition, Jakarta, Indonesia, 30 October-1 November, 2007. |
| [17] | D. Ilk, R. Camacho Velazquez, and T. Blasingame, "Inflow Performance Relationship (IPR) for Solution-Gas-Drive Reservoirs: Analytical Considerations", SPE Annual Technical Conference and Exhibition, 2007 Anaheim, California [http://dx.doi.org/10.2118/110821-MS] |
| [18] | A. Jahanbani, and S.R. Shadizadeh, "Determination of Inflow Performance Relationship (IPR) by Well Testing", Canadian International Petroleum Conference (CIPC), 2009 Calgary, Alberta [http://dx.doi.org/10.2118/2009-086] |
| [19] | M. Elias, A. El-banbi, K.A. Fattah, and E. El-Tayeb, "New Inflow Performance Relationship for Solution Gas-Drive Oil Reservoirs", SPE Annual Technical Conference and Exhibition, 2009 New Orleans, Louisiana [http://dx.doi.org/10.2118/124041-MS] |
| [20] | M. Khasanov, V. Krasnov, R. Khabibullin, and T. Musabirov, "Self Consistent Approach to Construct Inflow Performance Relationship for Oil Well", SPE Russian Oil and Gas Exploration and Production Technical Conference and Exhibition, 2012 Moscow, Russia |
| [21] | K.E. Brown, "Overview of Artificial Lift Systems", J. Pet. Technol., vol. 34, pp. 2384-2396, 1982. [http://dx.doi.org/10.2118/9979-PA] |
| [22] | D.J. Avery, and R.D. Evans, "Design Optimization of Plunger Lift System", Tianjin, China, 1988. [http://dx.doi.org/10.2118/17585-MS] |
| [23] | X. Yu, H. Xia, Y. Zhang, and J. Li, "Calculation of IPR Curves of Oil Wells for Polymer Flooding Reservoirs", SPE Annual Technical Conference and Exhibition, 1997 San Antonio, Texas [http://dx.doi.org/10.2118/38936-MS] |
| [24] | B. Guo, K. Ling, and A. Ghalambor, "A rigorous Composite-IPR for Multi-Lateral Wells", SPE Annual Technical Conference and Exhibition, 2006 San Antonio, Texas [http://dx.doi.org/10.2118/100923-MS] |
| [25] | Roxar, “MORE Manual - Version 6.3, 2006. |
| [26] | L. Breiman, and J.H. Friedman, "Estimating Optimal Transformations for multiple Regression and Correlation", J. Am. Stat. Assoc., vol. 80, pp. 580-598, 1985. [http://dx.doi.org/10.1080/01621459.1985.10478157] |
| [27] | G. Xue, A. Datta-Gupta, P. Valko, and T.A. Blasingame, "Optimal Transformations for Multiple Regression: Application to Permeability Estimation from Well Logs", SPE Formation Evaluation Journal, vol. 12, pp. 85-93, 1997. [http://dx.doi.org/10.2118/35412-PA] |
| [28] | W.D. Mc Cain Jr, R.B. Soto, P.P. Valko, and T.A. Blasingame, "Correlation of Bubble Point Pressures for Reservoir Oils – A Comparative Study", In: SPE Eastern Regional Conference and Exhibition, 1998 pp. 267-275 Pittsburgh, PA. |
| [29] | F. Gallice, "A Comparison of Two-Phase Inflow Performance Relationships", M.S. thesis, University of Oklahoma, Norman, Oklahoma, 1997. |
| [30] | J. R. Eickmeier, "How to Accurately Predict Future Well Productivities", World Oil, 1968. |