- Home
- About Journals
-
Information for Authors/ReviewersEditorial Policies
Publication Fee
Publication Cycle - Process Flowchart
Online Manuscript Submission and Tracking System
Publishing Ethics and Rectitude
Authorship
Author Benefits
Reviewer Guidelines
Guest Editor Guidelines
Peer Review Workflow
Quick Track Option
Copyediting Services
Bentham Open Membership
Bentham Open Advisory Board
Archiving Policies
Fabricating and Stating False Information
Post Publication Discussions and Corrections
Editorial Management
Advertise With Us
Funding Agencies
Rate List
Kudos
General FAQs
Special Fee Waivers and Discounts
- Contact
- Help
- About Us
- Search


The Open Petroleum Engineering Journal
(Discontinued)
ISSN: 1874-8341 ― Volume 12, 2019
Reservoir Characteristics and Three-dimensional Architectural Structure of a Complex Fault-block Reservoir, Beach Area, China
Xue Li*, Tao Tong, Tiedao Lu
Abstract
The objective area is a complex fault-block reservoir, and is provided by China Petroleum Engineering Design Competition(CPEDC). Reservoir characteristics, including stratigraphic features, vertical changes and section properties (thickness, percentage sand and percentage amalgamation) are documented. Based on comprehensive analysis on structural architecture and reservoir characteristics, a three-dimensional quantitative reservoir modeling is taken at a regional-scale of 69×97×37 m3 with the application of geostatistics as theoretical guidance, and thus high-resolution hierarchical reservoir model is generated with a combination of hierarchical data, structural data, physical data and well trajectory data. Therefore, the established three-dimensional geological model integrates all well-point information and structural information, and provides a basic model for subsequent sedimentary microfacies modeling and property modeling as well. Finally, three-dimensional fence diagrams, connecting-well sections and well group profiles are built successively.
Article Information

Identifiers and Pagination:
Year: 2017Volume: 10
First Page: 276
Last Page: 286
Publisher Id: TOPEJ-10-276
DOI: 10.2174/1874834101710010276
Article History:
Received Date: 16/7/2017Revision Received Date: 30/10/2017
Acceptance Date: 21/11/2017
Electronic publication date: 18/12/2017
Collection year: 2017
open-access license: This is an open access article distributed under the terms of the Creative Commons Attribution 4.0 International Public License (CC-BY 4.0), a copy of which is available at: https://creativecommons.org/licenses/by/4.0/legalcode. This license permits unrestricted use, distribution, and reproduction in any medium, provided the original author and source are credited.
* Address correspondence to this author at School of Petroleum Engineering, Changzhou University, Changzhou 213164, China, Tel: +86 15189714498; Email: lix@cczu.edu.cn
| Open Peer Review Details | |||
|---|---|---|---|
| Manuscript submitted on 16-7-2017 |
Original Manuscript | Reservoir Characteristics and Three-dimensional Architectural Structure of a Complex Fault-block Reservoir, Beach Area, China | |
1. INTRODUCTION
To represent spatial objects in three-dimensional space, the related three-dimensional model or data structures have been investigated, such as Grid system, Linear Octree, Fence diagram, Through-well profiles, Tetrahedron Network (TEN), etc [1M. Pilout, K. Tempfli, and M. Molenaar, M. Molenaar, and S de Hoop, "A tetrahedron-based on 3D vector data model for geoinformation", Delft, vol. 40, Advanced Geographic Data Modeling. Netherlands Geodetic Commission, Publications on Geodesy: The Netherlands, pp. 129-140.-4J.L. Martinez, M. Raiber, and D.I. Cendón, "Using 3D geological modelling and geochemical mixing models to characterise alluvial aquifer recharge sources in the upper Condamine River catchment, Queensland, Australia", Sci. Total Environ., vol. 574, pp. 1-18.
[http://dx.doi.org/10.1016/j.scitotenv.2016.09.029] [PMID: 27621088] ]. There are many varieties of geological model generated from different modeling methods and geologists [5S. Soubeyrand, "Review of Hierarchical Modeling and Analysis for Spatial Data by Banerjee, S., Carlin, B. P., and Gelfand, A. E", Math. Geosci., vol. 49, pp. 677-678.
[http://dx.doi.org/10.1007/s11004-016-9668-4] , 6N. Mery, X. Emery, A. Cáceres, D. Ribeiro, and E. Cunha, "Geostatistical modeling of the geological uncertainty in an iron ore deposit", Ore Geol. Rev., vol. 88, pp. 336-351.
[http://dx.doi.org/10.1016/j.oregeorev.2017.05.011] ]. Geological modeling often refers to raster-based or vector –based models, both of them have their own features and applicability. The description of 3D objects is aimed at skeleton modeling, surface modeling, inner modeling and property modeling, thus geological data should be taken into full consideration [7J. González-Garcia, and M. Jessell, "A 3D geological model for the Ruiz-Tolima Volcanic Massif (Colombia): Assessment of geological uncertainty using a stochastic approach based on Bézier curve design", Tectonophysics, vol. 687, pp. 139-157.
[http://dx.doi.org/10.1016/j.tecto.2016.09.011] ]. Geological data includes cores, outcrops, logs, seismic data, test data, boreholes, maps, and so on [8C. Bourdeau, L. Lenti, S. Martino, O. Oguz, and S. Coccia, "Comprehensive analysis of the local seismic response in the complex Büyükçekmece landslide area (Turkey) by engineering-geological and numerical modeling", Eng. Geol., vol. 218, pp. 90-106.
[http://dx.doi.org/10.1016/j.enggeo.2017.01.005] ]. Meanwhile, fence diagram or profiles represent the inner structure of a geological body and they are the two issues of crucial importance [9M.A. Lemon, and L.N. Jones, "Building solid models from boreholes and user-defined cross sections", Comput. Geosci., vol. 29, pp. 547-555.
[http://dx.doi.org/10.1016/S0098-3004(03)00051-7] , 10A.K. Turner, and C.W. Gable, A Review of Geological Modeling: Colorado School of Mines, Golden, CO 80401, USA., .], but this allows geologist to understand the geological interior structure and optimize development schema accordingly. Therefore, it is worth conducting detailed studies on reservoir characteristics and three-dimensional architectural structure of the study area.
In this paper, based on Geometric Volume modeling, Minimum Curvature Interpolation, Arithmetic and Harmonic methods, a regional three-dimensional geological model is established in accordance with the complexity and actual feature of geological entities. Moreover, profiles and fence models are accordingly built in order to display the internal characteristics of geologic body in detail.
2. GEOLOGICAL SETTING
The area investigated in this study covers an area of 5.5 Km2, about 1858m wide from east to west and 2980m long from north to south. The nearest oil storage is 120 mile away from the study area. The regional water depth of the study area ranges from 1350 m to 1525 m. The regional terrain map is shown in Fig. (1A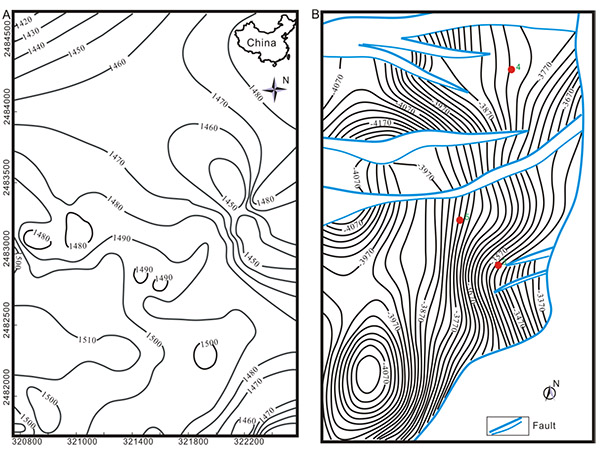 ).
).

2.1. Tectonic Characteristics
The study area is a northeast-trending semi-anticlinal reservoir complicated by faults within the study area Fig. (1B). The east boundary fault runs through the whole study area, thus producing a series of EW trending faults and well-developed fault zone in consequence as well.
The activities of faults mainly happen during the deposition of CPEDC3 and CPEDC2, and weaken in other deposition period. There are altogether three groups of faults: One group is the east boundary fault which is in NE trending throughout the whole study area, and thus controls the regional structure and sedimentary evolution; Another group is a NEE trending fault extending from 4.3 km to 6.4 km with the fault displacement ranging from 180 m to 740m, and displays in echelon arrangement; Others are secondary faults with characteristics of small fault displacement and short extended distance, making the regional structure more complicated.
2.2. Regional Stratigraphy
The formations of the study area in decreasing age order are A formation of Quaternary, B1 and B2 formations of Neogene, C1 and C2 formations of Paleogene. The main oil-bearing formation is the third member of C2 formation(CPEDC3). The formation development of the study area is shown in Fig. (2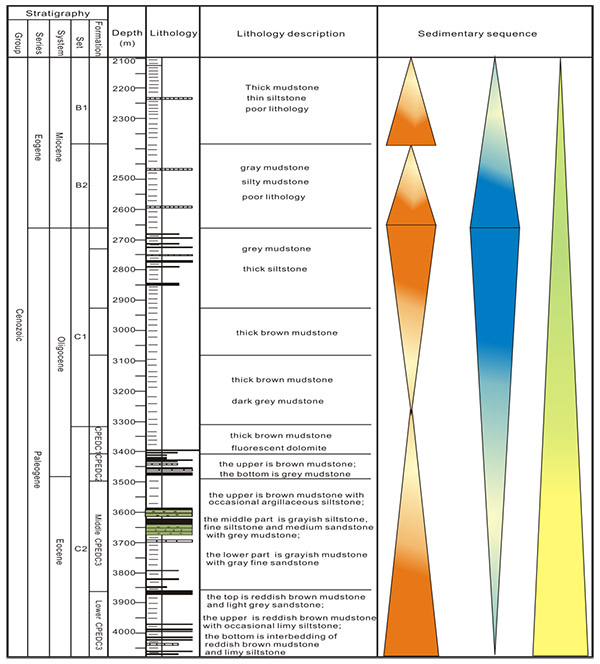 ).
).
The C2 set can be divided into four formations, in decreasing age order, they are the first member of CPEDC formation(CPEDC1), the second member of CPEDC formation(CPEDC2), the third member of CPEDC formation(CPEDC3) and the fourth member of CPEDC formation(CPEDC4), respectively. However, the effective drilling stratums include CPEDC1, CPEDC2 and CPEDC3, among which, CPEDC3 can be further subdivided into three submembers: the upper submember, the middle submember and the lower submember.
 |
Fig. (2) Synthetical stratum histogram of the study area, displaying the main lithologic characteristics and sedimentary sequences from sedimentological interpretation. |
The stratum thickness of CPEDC1 ranges between 60.5 m and 157 m, the dominant lithology of the study area is brownish gray mudstone with little internal calcareous shale, and argillaceous dolomite is developed locally. In short, CPEDC1 is a set of special lithologic section.
The stratum thickness of CPEDC2 ranges from 41.5 m to 115 m. The upper part of CPEDC2 is brownish gray mudstone with a small amount of siltstone. The lower part is gray mudstone and many interbeddings between light grey fine sandstone and pebbly sandstone with different thickness.
The upper stratum of CPEDC3 is lost, and the stratigraphic thicknesses of the middle CPEDC3 ranges between 204.5 m and 746.5 m which is displayed by well drilling. The main lithology is light gray and brown mudstone, and a set of reservoir develops in the middle layer of mudstone with thickness of 18.5 m to 166.5 m. The lower stratum of CPEDC3 shows many interbeddings of reddish brown mudstone and gray siltstone with different thickness.
3. RESERVOIR CHARACTERISTICS
3.1. Petrologic Characteristics
The main lithology of CPEDC3 is fine-grained sandstone and pebbly coarse sandstone with good sorting and low texture maturity. And petrology refers to feldspar lithic sandstone and arkoses. The mineral composition includes quartz, feldspar and debris with the average content of 33.7%, 34.9% and 31.4%, respectively Fig. (3A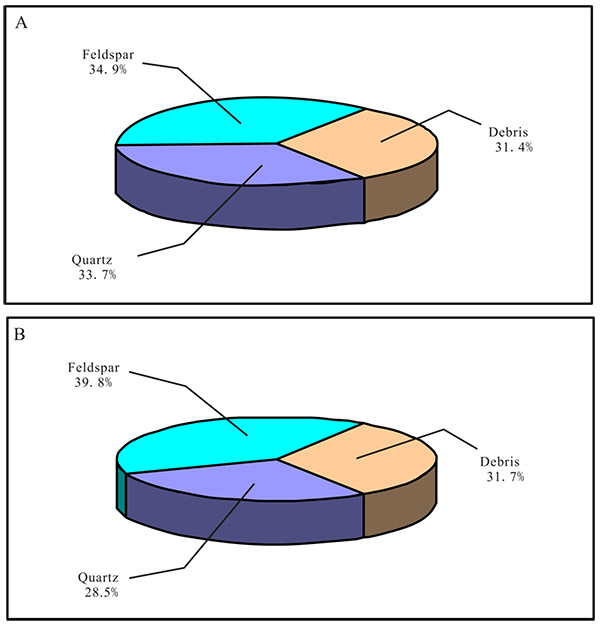 ). The roundness of particles is mainly sub-rounded and subangular, and the median particle size is generally between 14 and 479μm. The X-ray diffraction analysis shows that the primary clay minerals are kaolinite and illite/smectite, which are followed by illite and chlorite.
 |
Fig. (3) The reservoir petrologic characteristics of the study area. A: petrologic characteristics of CPEDC3; B: petrologic characteristics of CPEDC2. |
The dominant lithology of CPEDC2 is fine-grained sandstone and pebbly coarse sandstone with medium sorting. Petrology named feldspar lithic sandstone and lithic feldspathic sandstone, and the main mineral components are quartz, feldspar and debris with the average content of 28.5%, 39.8% and 31.7%, respectively Fig. (3B). The roundness of particles is mainly sub-rounded and subangular, and the median particle size ranges from 38μm to 461μm. The X-ray diffraction analysis shows that the most abundant clay minerals are kaolinite and illite/smectite, followed by illite and chlorite.
3.2. Physical Property
The porosity of CPEDC2 ranges between 4.5% and 40.1% with an average of 22.5%. And the distribution range of permeability is from 0.1mD to 1687.8 mD, with an average 267.9 mD.
The main capillary curve is coarse slanting degrees with the following characteristics: drainage pressure ranging from 0.013 to 0.298MPa, median saturation pressure ranging from 0.112 to 2.433MPa and average pore throat radius ranging from 0.811 to 7.481μm. The general reservoir characteristic of the study area is medium porosity and medium permeability.
The porosity of CPEDC3 ranges between 9.8% and 34.8% with an average of 21.3%. And the distribution scope of permeability is from 0.2mD to 3535.1 mD, and 382.3 mD on average.
The main capillary curve is medium-coarse slanting degrees with characteristics of drainage pressure ranging from 0.013 MPa to 0.997 MPa, median saturation pressure ranging from 0.098 MPa to 15.529 MPa and average pore throat radius ranging from 0.198 μm to 13.52 μm. The general characteristic of the reservoir in the study area is medium porosity and medium permeability.
4. MODELING METHOD
The modeling method which can be further divided into determinable modeling and stochastic modeling nicely reflects internal changes of geological body. However, both methods have their own advantages and disadvantages. With the increasing deepen on geological body research, it also exposes an increasing number of uncertain factors which exist in built determinable model. While, stochastic modeling method can effectively display and evaluate 3D geological model’s uncertainty.
4.1. Deterministic Modeling
Deterministic modeling, which usually refers to those methods used for construction graph, includes interpolation, Kriging and geomathematics [11F. Zhang, Z.P. Li, H.L. Wang, and J. Wu, "Sands modeling constrained by high-resolution seismic data", J. Zhejiang Univ. Sci. A, vol. 8, no. 11, pp. 1858-1863.
[http://dx.doi.org/10.1631/jzus.2007.A1858] ]. The property for the unknown area between wells is given by the deterministic modeling, but the premise is to know the basic information of the known wells, and thus to predict the exact inter-well parameters [12Oil/gas Reservoir Sedimentology of Clasolite Series., Petroleum Industry Express: Beijing, . (in Chinese)]. So far, there are mainly three kinds of reservoir prediction method belonging to deterministic modeling, they are seismological method, sedimentology method and Kriging method, respectively.
The study area is a structural reservoir mainly controlled by the structure and subsidiarily by the single sand body. The key points of the study area are the spatial distribution and the morphology of structure in three-dimensional space.
4.2. Stochastic Modeling
Based on known information and the random function as theoretical guidance, a series of optional and equal-possible reservoir models are generated with the use of stochastic simulation method. Indeed, stochastic simulation is a sampling process to extract the equal-possible part from the stochastic model.
Through comprehensive evaluation on uncertainty of those stochastic reservoir models, a geological model which is relatively related to the actual geology is consequently defined, which will meet the requirements of oilfield exploration and development decisions within a limited risk. According to the random characteristics of simulated objects, stochastic model can be divided into three types, they are discrete model, continuous model and mixed model, respectively. Discrete model is used to describe the geological characteristics with discrete features, such as sand body distribution, microfacies expansion, fracture or fault distribution, etc. Continuous model is to display the characteristics of continuous changes on reservoir parameters, such as porosity, permeability, oil saturation, etc.
Actually, the discrete and continuous features both do coexist in reservoir. The mixed model consists of discrete model and continuous model, which is also named two-step model. The first step is to build discrete model to describe the reservoir heterogeneity characteristics in a wide range, and the second step is to establish continuous model for describing spatial changes and distribution of rock parameters.
5. RESULTS AND DISCUSSIONS
5.1. 3D Integrated Structural Modeling
The 3D visualization technology and virtual reality technology provide a favorable tool for people to observe and analyze the underground geological body [13Y.L. Shao, A.L. Zheng, Y.B. He, and K.Y. Xiao, "3D Geological Modeling and Its Application under Complex Geological Conditions", Procedia Eng., vol. 12, pp. 41-46.
[http://dx.doi.org/10.1016/j.proeng.2011.05.008] ], whose essence is to project geological phenomena in 3D space, such as stratum, structure and reservoir heterogeneity [14H.T. Wang, Y.B. Li, and J.H. Xi, "Three-dimensional geological modeling technology and the application in city construction", Science of Surveying and Mapping (in Chinese), vol. 35, no. 5, pp. 220-222.].
5.1.1. Modeling Data
There are a total of 5 wells in the study area. The modeling data in this paper involves: 1) well drilling data(including well name, x-coordinate, y-coordinate and bushing elevation) which is used for describing well location; 2) well trajectory data, which is used for recording well trajectory such as well deviation and azimuth in an interval for 30 meters; 3) well tops data, which is used for describing drilling horizon and the corresponding depth; 4) well horizon data, used for the stratification of the study area; 5) structural map, which is used for digitizing fault and building constraining surface for horizons.
5.1.2. Fault Modeling
Three aspects need to be considered in fault modeling: the fault geometry is modeled as a surface [15P. Calcagno, J.P. Chilès, G. Courrioux, and A. Guillen, "Geological modelling from field data and geological knowledge Part I. Modelling method coupling 3D potential-field interpolation and geological rules", Phys. Earth Planet. Inter., vol. 171, pp. 147-157. [J].
[http://dx.doi.org/10.1016/j.pepi.2008.06.013] ]; how faults terminate in 3D space and the connection relationship between faults; the dip, the angle and the displacement, the relationship between hanging wall and footwall of faults.
- The two sides of a fault (including hanging wall and footwall) are both digitized from structural map and thus fault polygons are formed which will be used to define the positions of the fault surface in depth;
- Fault pillars, which can be a vertical line, straight line, spade line or curve comprised by two, three or five key points, are built from fault polygons with fault generated function;
- Fault dip, azimuth, length and shape are all defined by fault pillars, and so does each fault of 3D gridding;
- When all faults are described in detail with the key pillar, and have been properly connected, the framework of 3D fault model has been completely established.
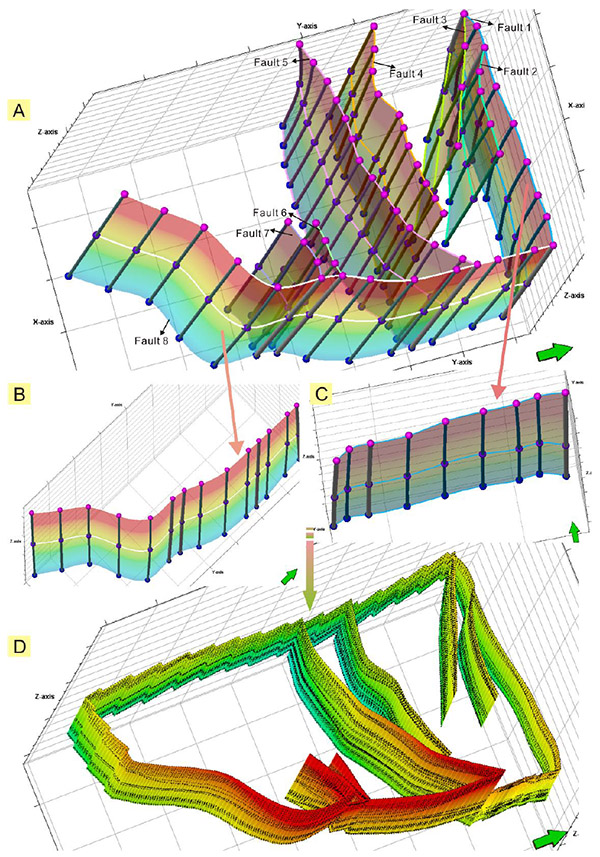
There are a total of eight faults in the study area, most of which are intersecting faults. The large fault which is located in the eastern part of the study area is considered as a boundary of fault modeling.
On the basis of fault data from fault digitization and human adjustments for faults based on geological analysis, then a smooth connecting between intersecting faults is build. The 3D model of faults is built by selecting Minimum Curvature interpolation, which can reflect 3D spatial distribution characteristics and combination features of faults. The 3D fault model of the study area is shown in Fig. (4 ).
).
5.1.3. Structural Model
Structural modeling is a basis and quite important step for the static reservoir modeling, and it can provide three-dimensional skeleton for reservoir property modeling and fluid parameter modeling, thus can be used as a predictive tool for the management and development of oilfields [16X. C. Freulon, and I. D. Dunderdale, "Integrating Field Measurements With Conceptual Models To Produce a Detailed 3D Geological Model", Soc. Pet. Eng., vol. 28877, pp. 99-108.]. In this study, facial modeling method is applied to establish structural model which is composed by geological surfaces and fault surfaces, and consequently a 3D skeleton of geological body is generated [17Y.L. Shao, "3D Geological Modeling under Extremely Complex Geological Conditions", J. Comput. (Taipei), vol. 7, no. 3, pp. 699-705.], as shown in Fig. (5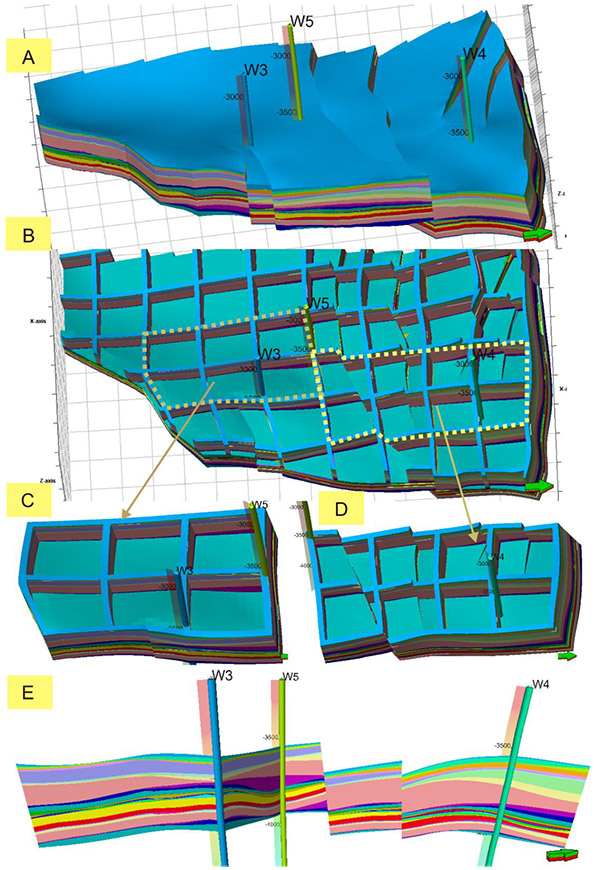 ).
).

The grid system is 30×30 m in the plane and 0.5 m in the vertical direction with a total number of 3D cells 247641, which is calculated from 69×97×37 in I, J, K direction, respectively; a total number of 3D nodes 260680, which is calculated from 70×98×38 in I, J, K direction, respectively; a total number of 2D cells 6693(calculated from 69×97) and a total number of 2D nodes 6860 (calculated from 70×98). Through making adjustment on geological surfaces’ morphology and their relationships, an integrated 3D structural model is formed by organizing different blocks which are subdivided by faults Fig. (5A). In order to display local structure, fence models Figs. (5B, C, D) cross-well profile Fig. (5E) and 3D structural model are all built without taking fault into consideration Fig. (6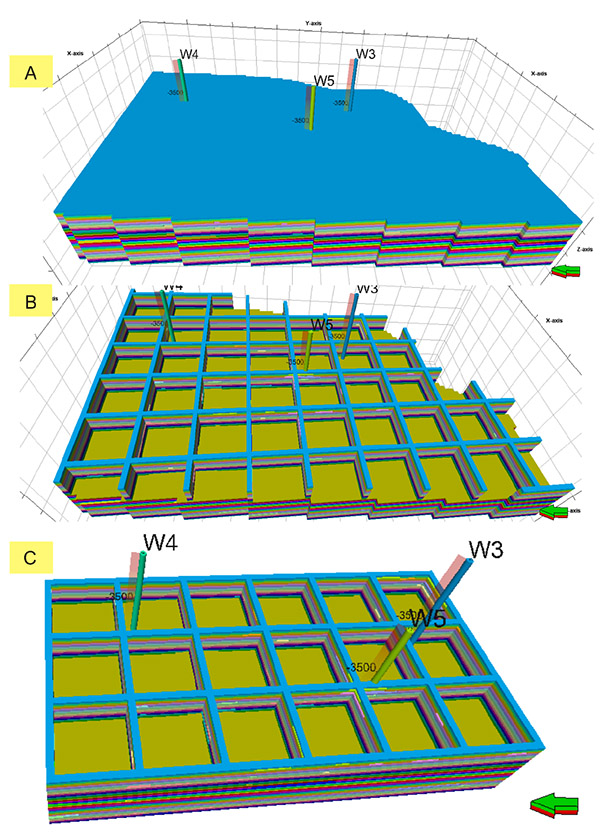 ), which are more intuitive in reflecting the internal structure characteristics and connections between different stratums.

5.2. Depositional Sand Body and Property Modeling
The CPEDC formation(including CPEDC1, CPEDC2 and CPEDC3) forms the primary target reservoir unit. Deposition of the CPEDC formation was partly controlled by the development of the local rift system with the thickness of single sedimentary sand body 8m on average. The porosity ranges between 15 and 30% which is measured by core material, the permeability ranges from 10 to 3500 mD and the shale content has a scope of 1.5 to 30%.
A regional sand body model is created from the available sand body data from well point data with sequential indication simulation. Mudstone and the interlayer are both labeled with gray Figs. (7A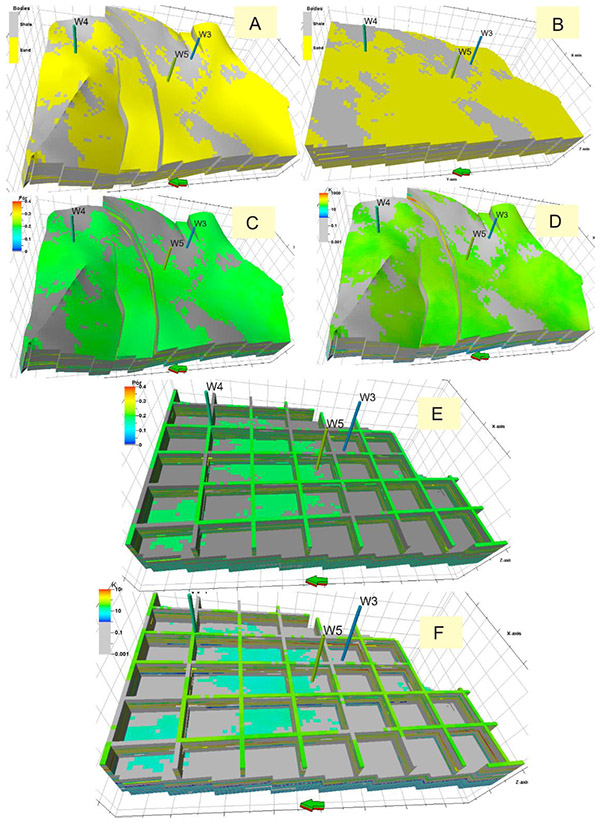 , B). At the beginning of property modeling, the most critical step is data analysis and variation function analysis, in which singular values are truncated to ensure the property data consistent with the actual reservoir physical property of the study area. In permeability modeling, singular values which are greater than 3000 are eliminated and the output data ranges between 10 and 2000 mD. Based on variation function analysis and adjustment on major range, minor range and vertical range, respectively, the permeability model and the porosity model are established with sequential gaussian simulation [18F.X. Chen, "The application of variogram in predicating braided river sandstone reservoir scale", Journal of Chongqing Science and Technology, vol. 10, pp. 9-11. [J]. [in Chinese].-20B. Hélène, and R. Didier, "Truncated Gaussian and derived methods", Math. Geol., vol. 348, pp. 510-519.]. From 3D porosity model and permeability model and their profiles Figs. (7C-F), it can be seen that the porosity distribution has good correlation with permeability, which are basically identical to the distribution of sand body, indicating a high reliability of property data analysis and a guarantee for later model simulation accordingly.

CONCLUSION
The geology bodies and fault development of the study area is complex and multiplex, thus this study is aimed to create a three-dimensional geological model which can realize 3D representations of complex characterization data and modeling in the case of insufficient data. The 3D fault model and structural model are both established according to the unique structure map provided by CPEDC, reflecting the spatial geological characteristics of the study area and providing some guidance and help for oilfield development schema, to a certain extent. However, fault-point data is essential for ensure the accuracy of fault modeling, thus the fault model established in this study is a general model and is suitable for the study area. In practical applications, the top structure map of layer is required to be available if possible; therefore, the fault evolution and changes in different formations can be obtained in detail, which will be helpful for fault modeling. Our application case is used in structure modeling with borehole sample data. Further work should be done taking more complex geological objects, comprehensive modeling, manipulation methods and visualization into consideration.
CONSENT FOR PUBLICATION
Agreed to publish.
CONFLICT OF INTEREST
The authors declare no conflict of interest, financial or otherwise.
ACKNOWLEDGEMENTS
This research was conducted with available data from China Petroleum Engineering Design Competition (CPEDC). Funding was provided by Natural Science Research of Jiangsu Higher Education Institutions (No.16KJA170004; No.16KJB620001), and major projects supported by National Scientific Fund(No.51204026) . Sincere thanks are extended to the sponsor, help sponsors and contractors of CPEDC. We also would like to express our sincere thanks to anonymous reviewers.
REFERENCES
| [1] | M. Pilout, K. Tempfli, and M. Molenaar, M. Molenaar, and S de Hoop, "A tetrahedron-based on 3D vector data model for geoinformation", Delft, vol. 40, Advanced Geographic Data Modeling. Netherlands Geodetic Commission, Publications on Geodesy: The Netherlands, pp. 129-140. |
| [2] | X.Y. Chen, H. Doihara, and M. Nasu, A workstation for three-dimensional spatial data research", Proceeding, 4th International Symposium of LIESMARS: Towards three-dimensional, temporal and dynamic spatial data modeling and analysis., Wuhan, China. pp. 42-51, 1998. |
| [3] | S.W. Houlding, 3D Geoscience Modeling Computer Techniques for Geological Characterization, Springer: New York, p. 303. [http://dx.doi.org/10.1007/978-3-642-79012-6] |
| [4] | J.L. Martinez, M. Raiber, and D.I. Cendón, "Using 3D geological modelling and geochemical mixing models to characterise alluvial aquifer recharge sources in the upper Condamine River catchment, Queensland, Australia", Sci. Total Environ., vol. 574, pp. 1-18. [http://dx.doi.org/10.1016/j.scitotenv.2016.09.029] [PMID: 27621088] |
| [5] | S. Soubeyrand, "Review of Hierarchical Modeling and Analysis for Spatial Data by Banerjee, S., Carlin, B. P., and Gelfand, A. E", Math. Geosci., vol. 49, pp. 677-678. [http://dx.doi.org/10.1007/s11004-016-9668-4] |
| [6] | N. Mery, X. Emery, A. Cáceres, D. Ribeiro, and E. Cunha, "Geostatistical modeling of the geological uncertainty in an iron ore deposit", Ore Geol. Rev., vol. 88, pp. 336-351. [http://dx.doi.org/10.1016/j.oregeorev.2017.05.011] |
| [7] | J. González-Garcia, and M. Jessell, "A 3D geological model for the Ruiz-Tolima Volcanic Massif (Colombia): Assessment of geological uncertainty using a stochastic approach based on Bézier curve design", Tectonophysics, vol. 687, pp. 139-157. [http://dx.doi.org/10.1016/j.tecto.2016.09.011] |
| [8] | C. Bourdeau, L. Lenti, S. Martino, O. Oguz, and S. Coccia, "Comprehensive analysis of the local seismic response in the complex Büyükçekmece landslide area (Turkey) by engineering-geological and numerical modeling", Eng. Geol., vol. 218, pp. 90-106. [http://dx.doi.org/10.1016/j.enggeo.2017.01.005] |
| [9] | M.A. Lemon, and L.N. Jones, "Building solid models from boreholes and user-defined cross sections", Comput. Geosci., vol. 29, pp. 547-555. [http://dx.doi.org/10.1016/S0098-3004(03)00051-7] |
| [10] | A.K. Turner, and C.W. Gable, A Review of Geological Modeling: Colorado School of Mines, Golden, CO 80401, USA., . |
| [11] | F. Zhang, Z.P. Li, H.L. Wang, and J. Wu, "Sands modeling constrained by high-resolution seismic data", J. Zhejiang Univ. Sci. A, vol. 8, no. 11, pp. 1858-1863. [http://dx.doi.org/10.1631/jzus.2007.A1858] |
| [12] | Oil/gas Reservoir Sedimentology of Clasolite Series., Petroleum Industry Express: Beijing, . (in Chinese) |
| [13] | Y.L. Shao, A.L. Zheng, Y.B. He, and K.Y. Xiao, "3D Geological Modeling and Its Application under Complex Geological Conditions", Procedia Eng., vol. 12, pp. 41-46. [http://dx.doi.org/10.1016/j.proeng.2011.05.008] |
| [14] | H.T. Wang, Y.B. Li, and J.H. Xi, "Three-dimensional geological modeling technology and the application in city construction", Science of Surveying and Mapping (in Chinese), vol. 35, no. 5, pp. 220-222. |
| [15] | P. Calcagno, J.P. Chilès, G. Courrioux, and A. Guillen, "Geological modelling from field data and geological knowledge Part I. Modelling method coupling 3D potential-field interpolation and geological rules", Phys. Earth Planet. Inter., vol. 171, pp. 147-157. [J]. [http://dx.doi.org/10.1016/j.pepi.2008.06.013] |
| [16] | X. C. Freulon, and I. D. Dunderdale, "Integrating Field Measurements With Conceptual Models To Produce a Detailed 3D Geological Model", Soc. Pet. Eng., vol. 28877, pp. 99-108. |
| [17] | Y.L. Shao, "3D Geological Modeling under Extremely Complex Geological Conditions", J. Comput. (Taipei), vol. 7, no. 3, pp. 699-705. |
| [18] | F.X. Chen, "The application of variogram in predicating braided river sandstone reservoir scale", Journal of Chongqing Science and Technology, vol. 10, pp. 9-11. [J]. [in Chinese]. |
| [19] | K. Guo, and J. Shi, Variogram law study of Donghe sandstone reservoir in Tazhong 4 block, 4, 4-8., . (in Chinese) |
| [20] | B. Hélène, and R. Didier, "Truncated Gaussian and derived methods", Math. Geol., vol. 348, pp. 510-519. |