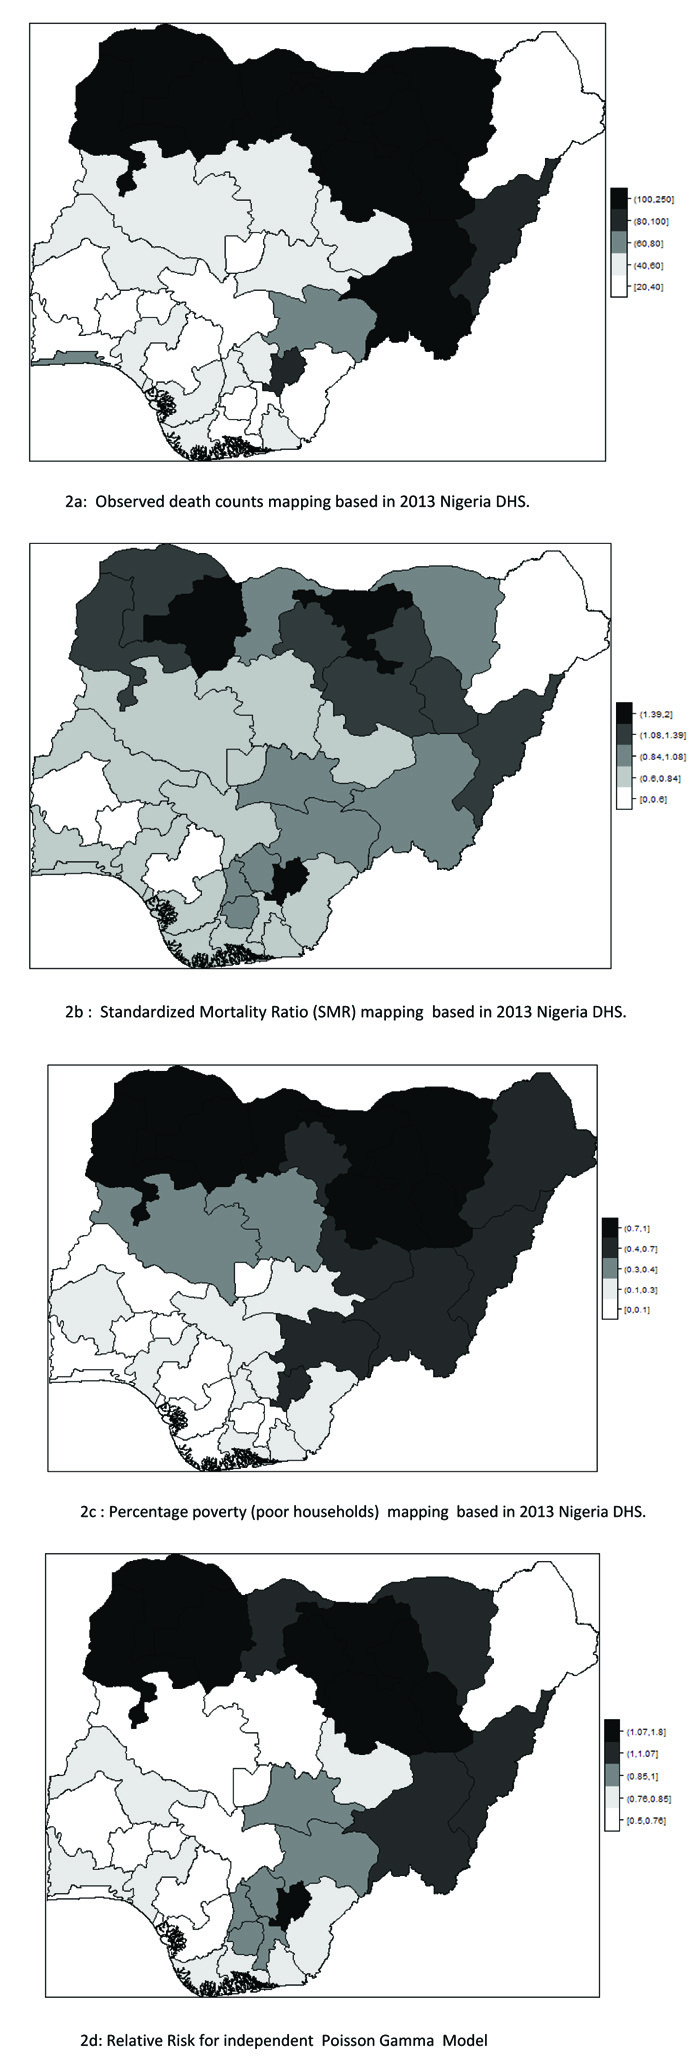
Fig. (2)
Descriptive summary maps: (a) observed child death counts, (b) crude standardized mortality ratio SMR (c) proportion of poor households (d) smoothed relative risk RR map from independent Poisson-Gamma distribution.