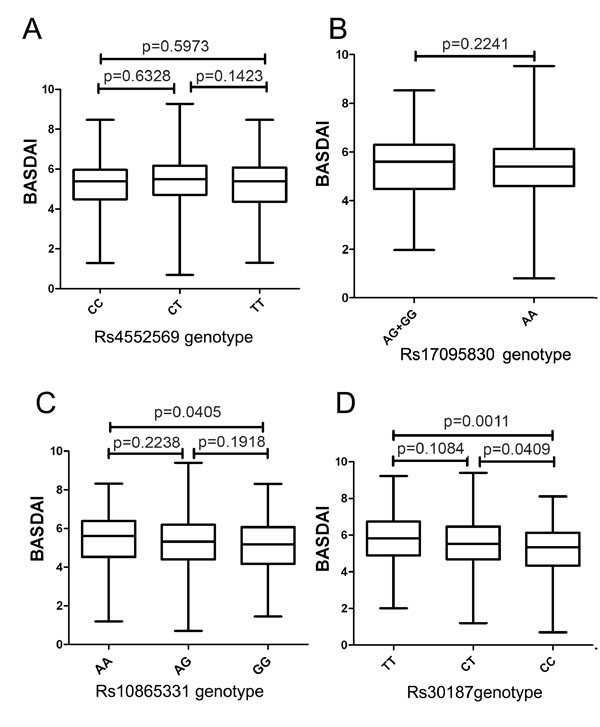
Fig. (1) Boxplots of BASDAI measured with median showing; box: 25th-75th percentile; bars: largest and smallest values within 1.5 box lengths. A) BASDAI in groups with different genotypes of rs4552569. B) BASDAI in groups with different genotypes of 17095830. C) BASDAI in groups with different genotypes of rs10865331. D) BASDAI in groups with different genotypes of rs30187.