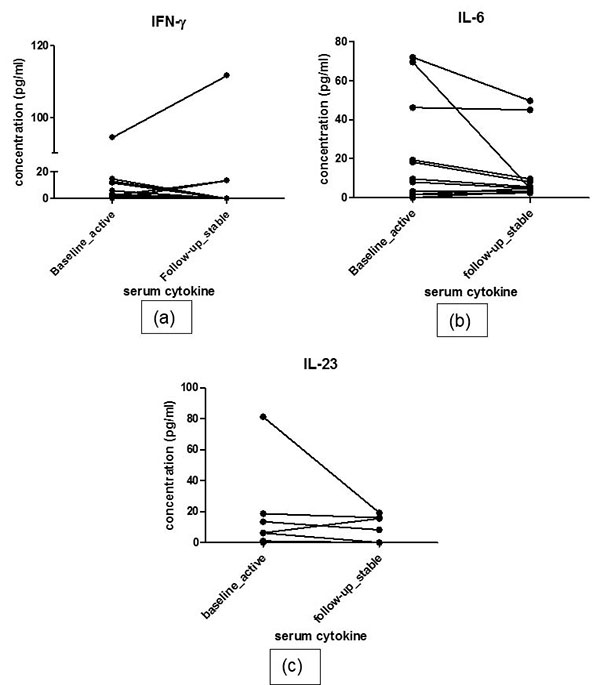
Fig. (2)
Represents the profile of pro-inflammatory cytokine profile in responders group. IFN-γ level at baseline and at follow-up (a). IL-6 level at baseline and at follow-up (b). IL-23 level at baseline and at follow-up (c).