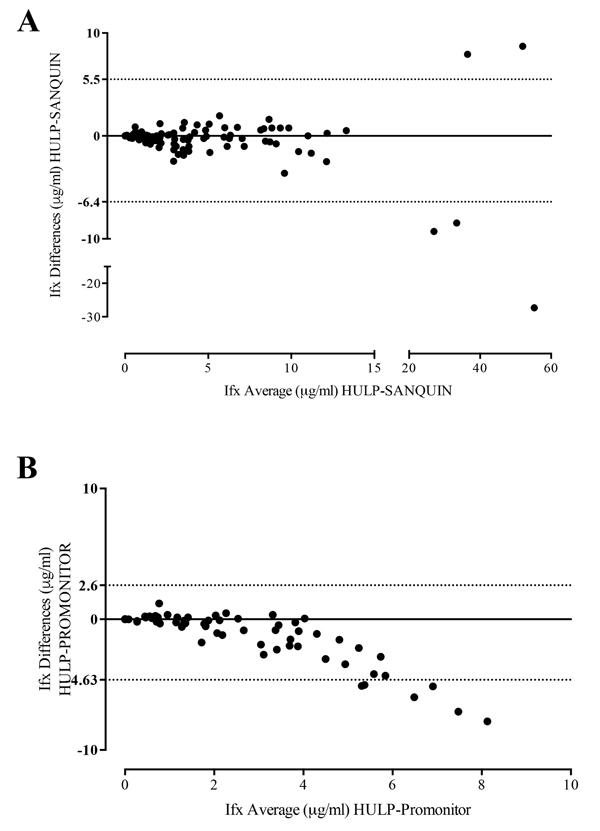
Fig. (S2) Comparison of IFX methods by Bland-Altman analysis. A) Bland-Altman analysis between UHLP and SANQUIN, the differences between the two measurements (Y-axis in µg/ml) is plotted against the average of each pair of measurements (X-axis in µg/ml), the 95% limits of agreement are represented by dot line. B) Bland-Altman analysis between UHLP and Promonitor, the differences between the two measurements (Y-axis in µg/ml) is plotted against the average of each pair of measurements (X-axis in µg/ml), the 95% limits of agreement are represented by dot line.