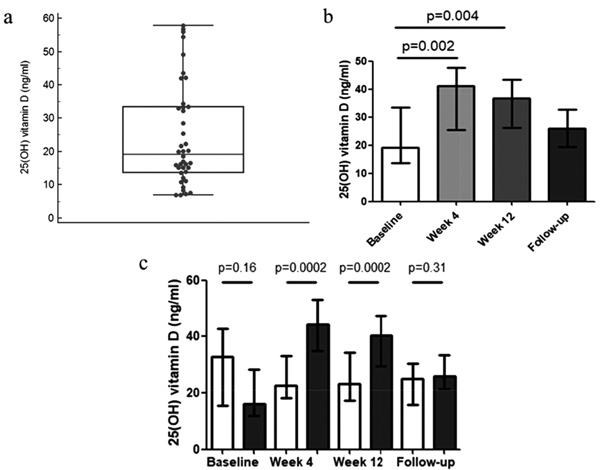
Fig. (1)
Plasma vitamin D in the study population. In panel (a), we report the box and whisker plot of vitamin D concentration in the general population. In panel (b), the histogram reports the median and the respective IQR of vitamin D concentration at the different time points (follow-up: 24 weeks after the end of treatment). In panel (c) we report the median vitamin D plasma concentration in supplemented patients (grey bars) and in not supplemented patients (white bars), at different time points.