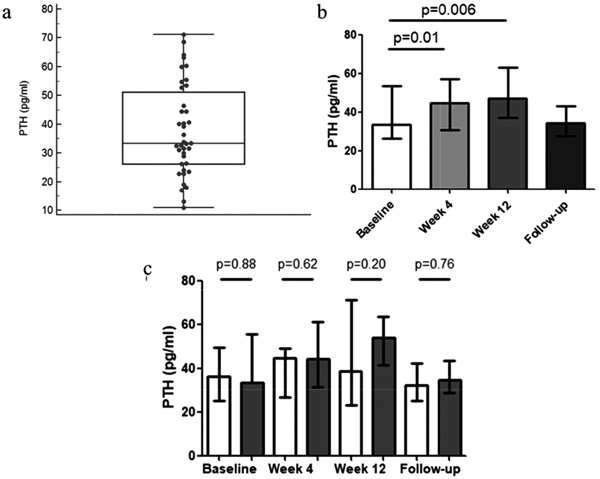
Fig. (2)
Blood parathyroid hormone (PTH) levels in the studied population). a) The graph shows the median value of PTH and bars indicate the 99th and 1st percentiles. Dots represent the values of single patients (N.=40). b) In the histogram are reported the median and the respective upper e lower values of PTH of all patients before (baseline), 4 weeks and 12 weeks after the beginning of the therapy and 24 weeks after the end of the anti-viral therapy (follow-up). c) Median with upper and lower values of PTH in patients supplemented (grey bars; N.=27) or not supplemented (white bars; N.=13) with vitamin D before (baseline), 4 weeks and 12 weeks after the beginning of the therapy and 24 weeks after the end of the anti-viral therapy (follow-up).