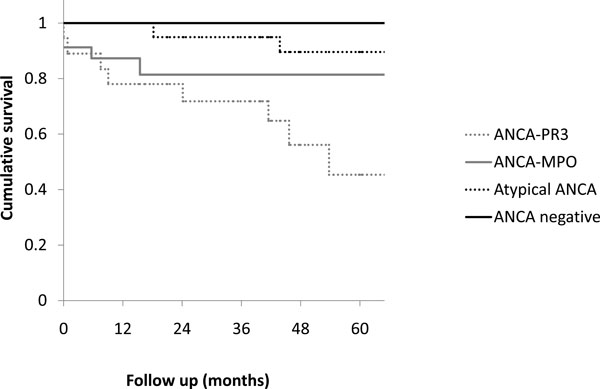
Fig. (1)
Calculated five year survival in respectively the ANCA-PR3-positive group, the ANCA-MPO-positive group, the atypical ANCA group and the ANCA-negative group. The curves differ significantly (P=0.012, Wilcoxon test).