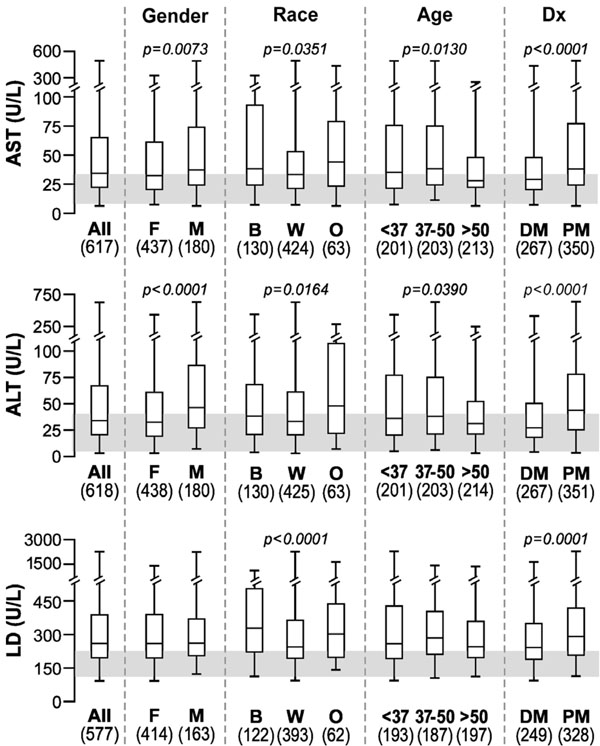
Fig. (2) Box plots showing the median, 25th and 75th percentiles and highest and lowest values for AST, ALT and LD in all myositis patients
and differences among groups. The shaded area depicts the normal range*.*Abbreviations: per Table 1 and Fig. (1).