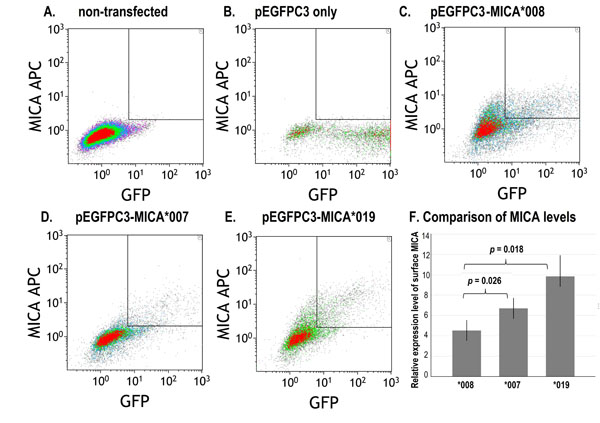
Fig. (1) A representative dot plot of three flow cytometry studies showed differential expression of membrane-bound (surface) MICA*008, *007 and *019 in
cultured fibroblasts. A. Fibroblasts without transfection; B. Fibroblasts transfected with pEGFPC3 without MICA; C. Fibroblasts transfected with pEGFPC3-
MICA*008; D. Fibroblasts transfected with pEGFPC3-MICA*007; E. Fibroblasts transfected with pEGFPC3-MICA*019; F. Relative expression levels of
surface MICA in three assays. MFI: mean fluorescence intensity. Error bars indicate standard deviations.