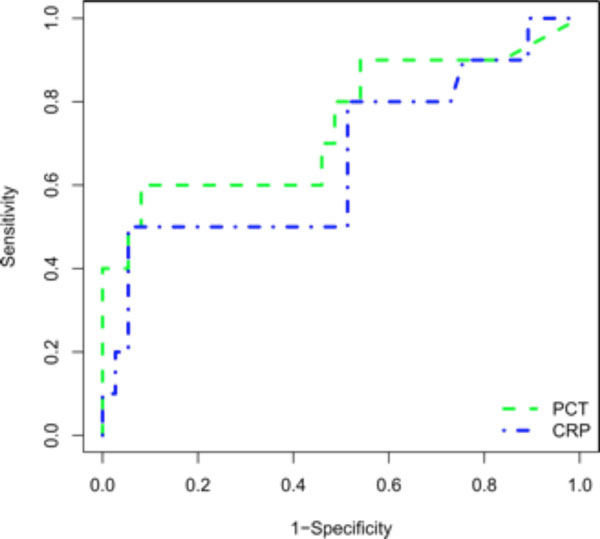
Fig. (2) Receiver operating characteristics (ROC) curve for CRP and PCT levels in differentiating bacterial infections (n=10) from AAV flares (n=36). The area under the curve (AUC) was 0.67 [95% CI 0.46-0.88, p ns] for CRP and 0.75 [95% CI 0.55-0.94, p=0.017] for PCT.