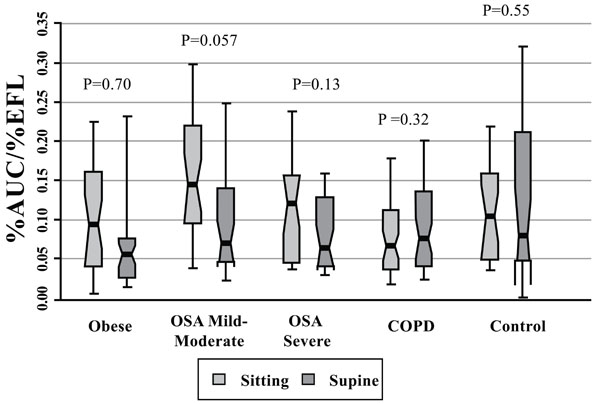
Fig. (9) %AUC/%EFL for patients with obesity alone, obstructive sleep apnea (OSA, mild-moderate, severe), COPD, and control subjects.
Each notched box represents the 25th-75th percentile; internal line indicates the median; whiskers indicate the 10th and 90th percentiles.
Notches extend to +/-1.58 inter-quartile range/sqrt(sample size). Notches that do not overlap suggest strong evidence of different medians.
The general linear model used to model the ranks of the test variable as a function of the sitting and supine groups, adjusted for age and sex,
showed that the mild-moderate OSA patients exhibited the highest value of all cohorts in seated posture (significantly different from the
seated COPD cohort only, P=0.04). There was no significant difference between sitting or supine position in any cohort [Wilcoxon signed
rank test (non-parametric paired-sample t-test) for comparisons between sitting and supine positions in each cohort].