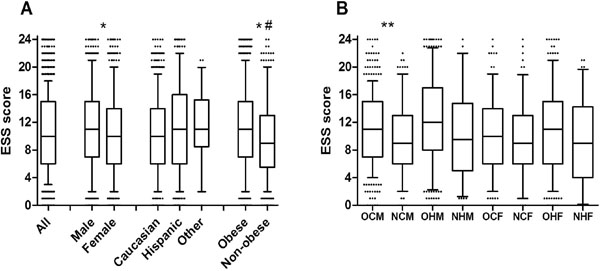
Fig. (1) Epworth Sleepiness Scale (ESS) scores of patients referred for polysomnography. (A) Box (25-75 percentile) and whisker (10-
90 percentile) plots are shown depicting the ESS scores of All (N = 1900), Male (N = 1092), Female (N = 805), Caucasian (N = 998),
Hispanic (856), Other ethnicities (Other, N = 46), Obese (N = 1370), and Non-obese (N = 529) patients. (B) Box and whisker plots are
shown for subgroups of patients: obese Caucasian males (OCM, N = 397), non-obese Caucasian males (NCM, N = 198), obese Hispanic
males (OHM, N = 364), non-obese Hispanic males (NHM, N = 104), obese Caucasian females (OCF, N = 269), non-obese Caucasian
females (NCF, N = 130), obese Hispanic females (OHF, N = 303), and non-obese Hispanic females (NHF, N = 82). # Non-obese patients
differed significantly in ESS scores than all patients. * ESS scores differed significantly between males and females, and between obese and
non-obese patients. ** ESS scores differed significantly between obese and non-obese Caucasian males.