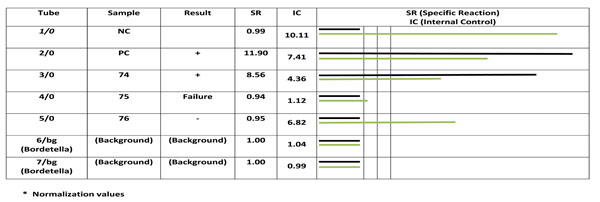
Fig. (1) Analyzing PCR product by fluorescence detector. Rows 1, and 2 are negative and positive controls respectively, row 3 to 5 are
patient’s samples. Rows 6 and 7 are background. Column 6 shows emitted signals of each reaction. Black and white colors represents
specific and competitive. The results of sample 198, 200 and 201 are positive, failure and negative. Sample number 200 shows an inhibition
that is due to improper extraction that must be repeated after new extraction or re-sampling.