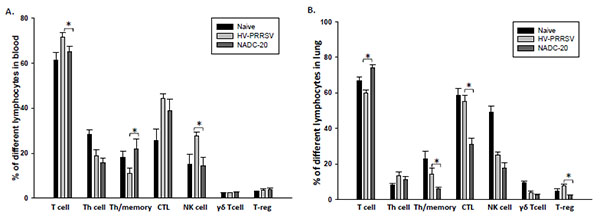
Fig. (5) T lymphocyte population profiles after PRRSV infection. Whole blood (A) and lung samples (B) were collected at necropsy and were used to analyze the percentage of different T lymphocyte populations by flow cytometer according to their phenotypes. Data were shown as mean ± SEM for 5 pigs per group. One asterisk denotes a statistically significant difference (P <0.05), and “NS” denotes there was no statistically significant difference.