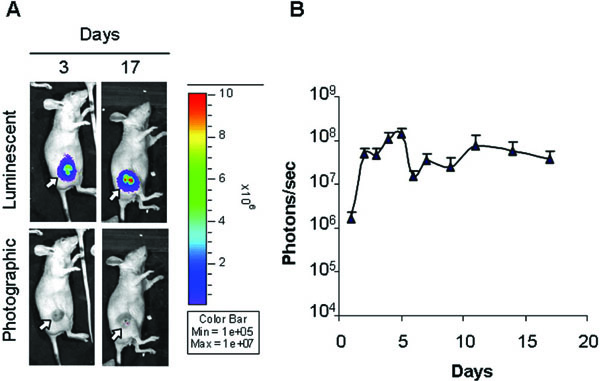
Fig. (3) Monitoring of virus transduction in a model of subcutaneous hepatocellular carcinoma (HCC) [367]. To follow HSV-1 C-gal-Luc
strain replication in the tumour mass the virus was inoculated into the experimental tumour, developed on the right flank of athymic mice,
and localization and intensity of luciferase expression was monitored by in vivo bioluminescence imaging. (A) Overlay
luminescent/photographic and photographic images of a representative animal at 3 and 17 days post-infection. The arrows indicate the
location of tumours. Intensity of light emission is represented by an artificial colour code normalized to allow comparison of different
acquisitions. The maximum (red) and minimum (blue) correspond to 107 and 105 photons/s, respectively. (B) Quantification of luciferase
activity over time. The average light emission in photons/s (n=7) is reported.