- Home
- About Journals
-
Information for Authors/ReviewersEditorial Policies
Publication Fee
Publication Cycle - Process Flowchart
Online Manuscript Submission and Tracking System
Publishing Ethics and Rectitude
Authorship
Author Benefits
Reviewer Guidelines
Guest Editor Guidelines
Peer Review Workflow
Quick Track Option
Copyediting Services
Bentham Open Membership
Bentham Open Advisory Board
Archiving Policies
Fabricating and Stating False Information
Post Publication Discussions and Corrections
Editorial Management
Advertise With Us
Funding Agencies
Rate List
Kudos
General FAQs
Special Fee Waivers and Discounts
- Contact
- Help
- About Us
- Search


The Open Waste Management Journal
(Discontinued)
ISSN: 1876-4002 ― Volume 13, 2020
Trade-offs between Manure Management with and without Biogas Production
Norbert Grösch1, Mitra K. Delivand1, 2, *, Mirko Barz1, Petra Bittrich1
Abstract
Introduction:
In rural developing countries with a traditional manure management, animal manure is a value-added agricultural commodity being utilized as a source of fuel and plant nutrients. The sustainable environmental management of this resource has to consider the whole upstream and downstream activities of current management systems.
Methods & Materials:
In line with this requirement, this study has integrated the Intergovernmental Panel on Climate Change (IPCC) method on manure managements into the life-cycle assessment of two different manure management systems: the traditional system without biogas production and the alternative system with biogas production. Special attention is given to compare the GHG emissions as well as Nitrogen (N), Phosphorous (P), and Potassium (K) Fertilizing Nutrients (NPK) from the two systems.
Results:
The great advantage of manure conversion to biogas is mainly due to the avoided wood (18 kg/animal.yr), crop-residues (12 kg/ animal.yr) and dung (8 kg/ animal.yr) used as cooking fuels in the region. If methane leakage is over 38% then this will offset the GHG emission reduction of manure-to-biogas system.
Article Information

Identifiers and Pagination:
Year: 2018Volume: 11
First Page: 1
Last Page: 11
Publisher Id: TOWMJ-11-1
DOI: 10.2174/1876400201811010001
Article History:
Received Date: 15/02/2018Revision Received Date: 15/04/2018
Acceptance Date: 17/04/2018
Electronic publication date: 30/04/2018
Collection year: 2018
open-access license: This is an open access article distributed under the terms of the Creative Commons Attribution 4.0 International Public License (CC-BY 4.0), a copy of which is available at: https://creativecommons.org/licenses/by/4.0/legalcode. This license permits unrestricted use, distribution, and reproduction in any medium, provided the original author and source are credited.
* Address correspondence to this author at the Environmental Research Institute (ERI), University College Cork, Mitra Kami Delivand, Energy Policy and Modelling Group, MaREI Centre, Cork, Ireland; Tel: 00353 21 4901981; E-mails: mitra.kamidelivand@ucc.ie, mkk1384@yahoo.com
| Open Peer Review Details | |||
|---|---|---|---|
| Manuscript submitted on 15-02-2018 |
Original Manuscript | Trade-offs between Manure Management with and without Biogas Production | |
1. INTRODUCTION
In traditional manure management in a rural society, manure is an agricultural commodity that can be used as a free source of cooking fuel and plant nutrients. Alternatively, sustainable management of animal waste through biogas generation is a renewable source of energy for cooking, which is one of the agenda items of the International Energy Agency [1International Energy Agency. Energy access outlook from poverty to prosperity. World energy outlook special report 2017]. Decentralized biogas options for rural energy supply would also provide opportunities to improve environmental conditions and economic status [2J. Yang, and B. Chen, "Emergy analysis of a biogas-linked agricultural system in rural China: A case study in Gongcheng Yao Autonomous County", Appl. Energy, vol. 118, pp. 173-182.
[http://dx.doi.org/10.1016/j.apenergy.2013.12.038] ]. The energy substitution and manure management would efficiently reduce the fossil fuel GHG emissions [3L. Yu, K. Yaoqiu, H. Ningsheng, W. Zhifeng, and X. Lianzhong, "Popularizing household-scale biogas digesters for rural sustainable energy development and greenhouse gas mitigation", Renew. Energy, vol. 33, no. 9, pp. 2027-2035.
[http://dx.doi.org/10.1016/j.renene.2007.12.004] ] and other environmental issues such as odors and pathogens.
Because of the importance of biogas in achieving sustainability, the assessment of its application has been performed in several case studies from various perspectives including: life cycle assessment of manure substrates [4P. Bojesson, and M. Maria Berglund, "Environmental systems analysis of biogas systems - Part II: The environmental impact of replacing various reference systems", Biomass Bioenergy, vol. 31, pp. 326-344.
[http://dx.doi.org/10.1016/j.biombioe.2007.01.004] -6D. Caro, S.J. Davis, S. Bastianoni, and K. Caldeira, Global and regional trends in greenhouse gas emissions from livestock. Clim. Chang., doi 10.1007/s10584-014-1197-x.]; the uncertainties regarding the effects of feedstock types [7A. Meyer-Aurich, A. Alexander Schattauer, H.J. Hellebrand, H. Klauss, M. Plöchl, and W. Berg, "Impact of uncertainties on greenhouse gas mitigation potential of biogas production from agricultural resources", Renew. Energy, vol. 37, no. 1, pp. 277-284.
[http://dx.doi.org/10.1016/j.renene.2011.06.030] ]; the techno-economic assessments to reduce the household energy bills [8D. Chadwick, S. Sommer, R. Thorman, D. Fangueiro, L. Cardenas, B. Amon, and T. Misselbrook, "Manure management: Implications for greenhouse gas emissions", Anim. Feed Sci. Technol., vol. 166–167, pp. 514-531.
[http://dx.doi.org/10.1016/j.anifeedsci.2011.04.036] ]; the comparison of the technical, economic and environmental sustainability for animal manure digestion in tubular and fixed dome and floating drum digesters [9C. Nzila, J. Dewulf, H. Spanjers, D. Tuigong, H. Kiriamiti, and H. van Langenhove, "Multi criteria sustainability assessment of biogas production in Kenya", Appl. Energy, vol. 93, pp. 496-506.
[http://dx.doi.org/10.1016/j.apenergy.2011.12.020] ]; and the socio-economic performance of the integrated co-digestion of manure with municipal solid waste [10M.V. Dael, S.V. Passel, L. Pelkmans, R. Guisson, P. Reumermann, N.M. Luzardo, N. Witters, and J. Broeze, "A techno-economic evaluation of a biomass energy conversion park", Appl. Energy, vol. 104, pp. 611-622.
[http://dx.doi.org/10.1016/j.apenergy.2012.11.071] ]. In comparison with other agricultural-based substrate for biogas, such as energy crops, straw and garden wastes, solid manure is found as an environmental sustainable substrate because of the reduced impacts imposed by the indirect land use [11L. Hamelin, I. Naroznova, and H. Wenze, "Environmental consequences of different carbon alternatives for increased manure-based biogas", Appl. Energy, vol. 114, pp. 774-782.
[http://dx.doi.org/10.1016/j.apenergy.2013.09.033] ]. It requires strict digester maintenance and biogas handling at the preliminary phase of installation of the small-scale biogas digesters to reduce methane leakage [12S Bruun, SL Jensen, VTK Vu, and S. Sommer, Small-scale household biogas digesters: An option for global warming mitigation or a potential climate bomb? 2014. Renewable and Sustainable Energy Reviews; 33: 736–741.
[http://dx.doi.org/10.1016/j.rser.2014.02.033] ].
Manure has a significant potential as an organic fertilizer in agriculture, and can be used to optimize the recycling of the excess nutrients for the management of intensive animal production [13J.B. Holm-Nielsen, T. Al Seadi, and P. Oleskowicz-Popiel, "The future of anaerobic digestion and biogas utilization", Bioresour. Technol., vol. 100, no. 22, pp. 5478-5484.
[http://dx.doi.org/10.1016/j.biortech.2008.12.046] [PMID: 19217772] ]. In different manure management systems, it is important to assess the balance of energy source and nutrient contents. This study addresses these issues and focuses on the environmental aspect of the two management policies where manure can be managed without biogas generation (traditional manure management) and with biogas generation (alternative manure management). The objective is to identify the associated life-cycle drivers and bottlenecks of major importance for these two management systems. The paper particularly sheds lights on the life-cycle fertilizer contents of the two manure management systems as well as on the calculation of biogas design, and the values of the displaced system (physical values and GHG emissions). Punjab-Pakistan is selected as a case study because in this region, manure is managed both traditionally and alternatively through biogas generation.
Although, this study envisages the regional and social characteristics of rural Punjab which affect the manure management and its utilizations, attempts are made to create a transparent method to make it possible for the researcher to repeat the analyses for specific local conditions. The results of this study, which is based on the realistic reference system, may contribute to the sustainable manure management in rural communities.
The rest of the paper is organized as follows: By adapting the Intergovernmental Panel on Climate Change (IPCC) method, the manure production on the basis of the feed-intakes, and livestock characteristics is estimated in section 2.1. Section 2.2 discusses the calculation method of potential biogas yields. By integrating the IPCC method with the Life-Cycle-Assessment (LCA) and other data from the literature, emissions from the managed soil and emissions from biogenic sources are calculated in section 2.3. The nutrient content and the associated GHG emissions of the digestate which could alternatively be used as fertilizer is discussed in section 2.4. Section 2.5 considers the reference flows which would be displaced in the alternative management system, and finally, the results and discussion are followed by conclusions which are presented in sections 3 and 4.
2. MATERIALS AND METHODS
The study has integrated the IPCC guidelines [14IPCC 2006a. Guidelines for National Greenhouse Gas Inventories. Volume 4: Agriculture, Forestry and Other Land Use. Chapter 10. Emissions from livestock and manure management. -16 IPCC, 2006C. IPCC Guidelines for National Greenhouse Gas Inventories. Volume 2: Energy.] into the life-cycle assessment for the manure management systems for the case study of Punjab, Pakistan. The system boundary is expanded to include the management options, application phases (cooking and biofertilizing purposes) and reference systems (displaced systems which would otherwise be used to produce heating fuel for rural community) as shown in Fig. (1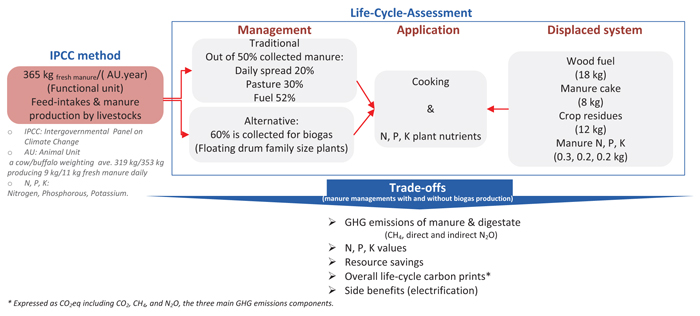 ). Tracing the carbon footprint includes the GHG emissions from the traditional manure management for fuels and fertilizing nutrients, as well as the alternative manure-to-biogas and digestate generation. In this study, manure refers to the solid waste of cows and buffalos (i.e., dung), the potential of which depends on the livestock characteristics (sex, age and weight and feed types). Secondary data from the national statistics, governmental website, reports, published papers, are the major databases used for the analysis which are explained in the text.
The study intends to look thoroughly at the life cycle carbon foot prints (in terms of GHG emissions) of manure management without biogas and with biogas generation as a contribution to the energy demand of the region and fertilizing supplements. Domestic fules (wood, crop residues, and manure cake) used for cooking in rural community and the potential of total nitrogen, phosphorous, and potassium (NPK) values of the reference systems are used to disucss the trade-offs between the two manure management systems. The functional unit (FU) of the study is 365 kg fresh manure produced annually (i.e. 1 kg day-1) from one Animal Unit (AU). AU is the representative animal of a cow and a buffalo weighing averagely 319 kg (producing 9.4 kg fresh manure), and 353 kg (producing 10.6 kg fresh manure), respectively (section 2.1). Carbon footprints are expressed in kg CO2 eq FU-1 using 100-year global warming measures of factors 1 for CO2, 25 for CH4, and 298 for N2O.
 |
Fig. (1) System boundary of the life cycle carbon footprints and NPK nutrient values of two manure management options. |
2.1. Manure Potentials
One-time animal inventory data can be used for the annual population of static animals like dairy or breading animals [14IPCC 2006a. Guidelines for National Greenhouse Gas Inventories. Volume 4: Agriculture, Forestry and Other Land Use. Chapter 10. Emissions from livestock and manure management. ]. Table 1 shows the distribution of populations according to the age and sex for the two understudy animals in the region.
The average weight of the various breed of a mature male and female cow as well as a mature male and female buffalo is 450 kg, 325 kg, 595 kg and 344 kg, respectively. The average weight of females for cows and buffaloes is aggregated for the milk and non-milk producing animals, and average weight of a young cow and buffalo is 270 kg and 290 kg. On this basis, the weighted average weight of an animal unit (AU) for cow is 319 kg and an AU of buffalo is 353 kg.
For estimating the amount of solid manure excreted from an animal unit, the study has used the IPCC guidelines [14IPCC 2006a. Guidelines for National Greenhouse Gas Inventories. Volume 4: Agriculture, Forestry and Other Land Use. Chapter 10. Emissions from livestock and manure management. ] and other literature data as follows:
- − Feeding both cows and buffaloes with green forage supplemented with cellulosic waste (low quality forages) which is one of the most practical and traditional methods [17S.K. Ranjhan, International Livestock Research Institute. Dairy cattle and buffalo. Retrieved on 06.04.2015 from http://www.ilri.org/InfoServ/Webpub/fulldocs/SmHDairy/chap7.html#Feeding.].
- − Digestibility of low quality forages is averagley 50%, i.e. the animal will excrete 50% of the dry matter feed intake that is not digested.
- − The daily dry matter intake for the mature or growing animal is in the order of 2% to 3% of the body weight (average 2.5%). In producing milk cows and buffaloes, the intake is about 4.5% of the body weight [14IPCC 2006a. Guidelines for National Greenhouse Gas Inventories. Volume 4: Agriculture, Forestry and Other Land Use. Chapter 10. Emissions from livestock and manure management. ].
- − The ratio of green grass to cellulosic residues on a dry matter basis varies from 1:1 for adult male animals, 3:1 for young animals, and 8:1 for milk producing animals [17S.K. Ranjhan, International Livestock Research Institute. Dairy cattle and buffalo. Retrieved on 06.04.2015 from http://www.ilri.org/InfoServ/Webpub/fulldocs/SmHDairy/chap7.html#Feeding.].
- − An average moisture content of 50% and 10% of the wet weight is considered for green grass and cellulosic residues.
The livestock is divided into four categories i: adult males, adult females, females in milk, and males or females below three years old (Table 1). Taking into account the above mentioned considerations, the estimation of manure quantity for one Animal Unit (AU) in kg (fresh-manure) day-1 is given through Eq. 1:
 |
where: LNi represent the population of livestock category i, BWi is the body weight of the animal category i in kg; feed factori is the percentage of the weight of the animal category i (either 2.5% or 4%); non-digestible factori of the dry feed is 50%; and the moisture-contenti varies from 30% to 46% depending on the ratios of grass and cellulosic residues for each category as mentioned above. LN is the total population of livestock in Table 1 (19.4 million cows and 22.5 million buffaloes as of year 2014). The livestock household population for each of the categories above is obtained from the Agricultural Census available in Pakistan government website (http://www.pbs.gov.pk/ agriculture-census-publications). The livestock number and the relevant daily manure produced per household are determined for each district.
2.2. Biogas Potentials for Domestic Use
The focus of the study is on small family size manure-based biogas plants which on average digest the manure of 4 to 10 animal units per day. The design parameters of such biogas plant and biogas yield calculations are presented here. The biogas yield is calculated in m3 biogas for each household based on the kg volatile solid (VS) of the manure input.
Floating drum digesters as the common designed digester for treating diluted dung [18S. Heiske, L. Jurgutis, and K. Zsófia, "Evaluation of novel inoculation strategies for solid state anaerobic digestion of Yam peelings in low-tech digesters", Energies, vol. 8, pp. 1802-1816.
[http://dx.doi.org/10.3390/en8031802] ] are considered. The following characteristics for the cow manure and for the buffalo manure are used:
- − Percentage weight of volatile solids (VS): 17.58 and 18.81 [19Kausar & Muller, 1983. Review on recycling of animal wastes as a source of nutrients for freshwater fish culture within an integrated livestock system. UNDP/FAO Project PAK/80/019. Retrieved on 15.05.2015 from http:// www.fao.org/docrep/ field/ 003/ ac526e/ ac526e02.html. ].
-
− General daily biogas production rate: ~0.05 m3 biogas per 1kg fresh dung [20A.S. Munawar, "Renewable energy resource potential in Pakistan", Renew. Sustain. Energy Rev., vol. 13, pp. 2696-2702.
[http://dx.doi.org/10.1016/j.rser.2009.06.029] ]. - − Percentage total solids of the slurry in the floating drum digester: 7.5%.
- − Density of biogas as 1.28 kg m-3,.
- − Moisture content of digestate: 93%, with the volatile organic matter of 64% [21S. Kumar, L.C. Malav, M.K. Malav, and S.A. Khan, "Biogas Slurry: Source of Nutrients for Eco-friendly Agriculture", Int. J Ext Res., vol. 2, pp. 42-46.].
- − Biogas losses: 10% [22ADB (Asian Development Bank) Energy access assessment Punjab (Pakistan). ADB energy for all program. Final report 2014: http://www.energyforall.info/wp-content/uploads/2012/07/Punjab-Energy-Access-Assessment-Report-Final.pdf. ].
On the basis of the assumed parameters above, the dilute ratio of manure with water would be around 1.3 kg kg-1. Equations for calculating biogas yields are presented in Table 2.
2.3. Estimation of GHG Emissions from Manure Management
Traditionally, manure is partially used to fertilize the soil. Two sources of GHG emissions from manure are: methane (CH4) emissions, and direct and indirect nitrous oxide (N2O) emissions. The common current manure management system in the region is considered as: manure in solid form applied to field regularly, deposition of manure by grazing animal on pasture, and the feces dried in cakes burnt for fuel (Table 3). Since the temperature affects the CH4 emissions of the manure, the annual average temperature of the districts (10-year mean of minimum and maximum) are collected from the worldweatheronline.com. The average minimum temperature of 11°C to 15°C in few regions in the north and average maximum of 22°C to 33°C in the other regions are observed.
2.3.1. CH4 Emissions of Manure Management
Following the IPCC calculation method (Tier 1 and Tier 2), for the CH4 emissions from manure management, first the population of the livestock is subcategorized into animal in milk (cows and buffaloes), and other cattle and buffalo, i.e., subcategory(t). The percentage distribution of the livestock types in Table 1 is used to estimate the livestock population for each categorized group. In the next step, the specific emission factor EF for each livestock subcategory(t) is determined through Eq. 7 [14IPCC 2006a. Guidelines for National Greenhouse Gas Inventories. Volume 4: Agriculture, Forestry and Other Land Use. Chapter 10. Emissions from livestock and manure management. ].
 |
(7) |
where: EF is the annual CH4 emissions in kg CH4 FU-1; VSt is the relative volatile solid of manure for livestock subcategory(t) in kg(dry-matter) FU-1; Bo is the maximum CH4 emissions from livestock subcategory (t) in m3 kg(VS)-1; MCFst is the methane conversion factor in temperate, warm and cold climate for each manure management system(s) of the subcategory(t) in percentage (three dominant manure management systems are pasture, daily spread, and fuel cake); MSst is the fraction of the manure management system(s) for the livestock subcategory(t). A density of 0.67 kg m-3 is used to convert the CH4 volume to mass. The base data for components of Eq. 7 is given in Table 3. The volatile solids (VS) of manure for cows and buffalos are adopted from [19Kausar & Muller, 1983. Review on recycling of animal wastes as a source of nutrients for freshwater fish culture within an integrated livestock system. UNDP/FAO Project PAK/80/019. Retrieved on 15.05.2015 from http:// www.fao.org/docrep/ field/ 003/ ac526e/ ac526e02.html. ] as 14% and 16% of the fresh manure weight, with moisture content of 82% and 81%, for cows and buffaloes, respectively.
Base data used for CH4 emissions of manure management in the region [14IPCC 2006a. Guidelines for National Greenhouse Gas Inventories. Volume 4: Agriculture, Forestry and Other Land Use. Chapter 10. Emissions from livestock and manure management. ].
2.3.2. N2O Emissions of Manure Management
According to the IPCC [14IPCC 2006a. Guidelines for National Greenhouse Gas Inventories. Volume 4: Agriculture, Forestry and Other Land Use. Chapter 10. Emissions from livestock and manure management. ], the default emission factor for direct N2O emissions from daily spreading of manure is assumed to be zero. However, the related indirect N2O emissions as well as the direct and indirect N2O emissions associated with the manure management in pasture is calculated from IPCC methods on managed soil [15 IPCC, 2006b. Guidelines for National Greenhouse Gas Inventories. Volume 4: Agriculture, Forestry and Other Land Use. Chapter 11:N2O Emissions from Managed Soils, and CO2 Emissions from Lime and Urea Application.]. The direct and indirect N2O emissions refer to the emissions from manure-N inputs to manage soil, and to the ammonium-N and NOx emissions plus leaching NH4+ and NO3-, respectively [15 IPCC, 2006b. Guidelines for National Greenhouse Gas Inventories. Volume 4: Agriculture, Forestry and Other Land Use. Chapter 11:N2O Emissions from Managed Soils, and CO2 Emissions from Lime and Urea Application.].
The average total-N content of cow’s and buffalo’s manure is considered as ~1.0% on dry basis [23M.K. Hasanuzzaman, U. Ahmed, K. Nahar, and N. Akhter, "Plant growth pattern, tiller dynamics and dry matter accumulation of wetland rice (Oryza sativa L.) as influenced by application of different manures", Nat. Sci., vol. 8, no. 4, pp. 1-10.http://www.e3journals.org/ cms/ articles/ 1411271518_Sohail%20et%20al.pdf-25A. Yadav, R. Gupta, and V.K. Garg, "Organic manure production from cow dung and biogas plant slurry by vermicomposting under field conditions", Int. J. Recycl. Org. Waste Agric., vol. 2, pp. 21-28.
[http://dx.doi.org/10.1186/2251-7715-2-21] ]. The total N2O emissions comprise of the summation of direct emissions (Eq. 8) and indirect emissions (Eq. 9) formulated as follows [15 IPCC, 2006b. Guidelines for National Greenhouse Gas Inventories. Volume 4: Agriculture, Forestry and Other Land Use. Chapter 11:N2O Emissions from Managed Soils, and CO2 Emissions from Lime and Urea Application.]:
 |
(8) |
where: N2O-direct is the direct-N2O emissions into atmosphere as kg N2O FU-1, FPRt is the annual amount of organic N deposited on pasture from grazing livestock subcategory(t) in kg N FU-1, EF1 is the emission factor for N2O emissions of FPR that is 0.02, Constant 44/28 is the conversion factor of N2O-N to N2O emission. MS is the manure management systems (in percentage) for each livestock subcategory (t) cited in Table 3.
 |
(9) |
where: N2O-indirect is the annual amount of N2O emissions produced from atmospheric deposition of N volatilized from managed soils in kg N2O FU-1, Frac1 is the fraction of FAM and FPR which will be volatilized as NH3 and NOx that is 0.20, EF2 is the emissions factor for N2O emissions ((kg N2O-N per kg NH3-N+NOx-N volatilized) that is 0.01, Frac2 is the fraction of leaching and runoff of FAM and FPR that is 0.30, and EF3 is the emissions factor for N2O emissions from N leaching and runoff that is 0.0075.
2.4. Nutrient Content of Digestate and its GHG Emissions
One of the important resources for improving soil conditions is the supplement organic matters in the animal wastes [25A. Yadav, R. Gupta, and V.K. Garg, "Organic manure production from cow dung and biogas plant slurry by vermicomposting under field conditions", Int. J. Recycl. Org. Waste Agric., vol. 2, pp. 21-28.
[http://dx.doi.org/10.1186/2251-7715-2-21] ]. As mentioned earlier, in the region ~ 52% of the collected manure is used for fuel, and the rest is mainly managed either as daily spreading or as pasture Table 3. In the alternative manure management for biogas generation, the digestate can be used as the organic supplement for the soil. However, the GHG emissions associated with digestate should also be taken into account.
For this purpose, the emission factors for N2O emissions (kg N2O-N per kg N in slurry) are 0.01 for direct emission; 0.002 for indirect volatilized; and 0.0023 for indirect runoff [15 IPCC, 2006b. Guidelines for National Greenhouse Gas Inventories. Volume 4: Agriculture, Forestry and Other Land Use. Chapter 11:N2O Emissions from Managed Soils, and CO2 Emissions from Lime and Urea Application.]. The average total N of dung digestate is 1.0% [26P. Wallace, 2011. Digestates: Realizing the fertilizer benefits for crops and grassland. Project code: OAV036-210. Retrieved on 01.01.2015 from http://www.wrapcymru.org.uk/sites/files/wrap/Farmer%20guidance%20final%20-%20Cymru.pdf.] on dry weight basis. The average percentage phosphorous (P) and potassium (K) are about 1.1% [21S. Kumar, L.C. Malav, M.K. Malav, and S.A. Khan, "Biogas Slurry: Source of Nutrients for Eco-friendly Agriculture", Int. J Ext Res., vol. 2, pp. 42-46., 27M. Yasin, and M. Wasim, "Aanaerobic digestion of buffalo dung, sheep waste and poultry litter for biogas production", J. Agric. Res. (Lahore), vol. 49, pp. 1-10.http://www.jar.com.pk/upload/1374663342_88_35__73Paper-9-JAR-49%281%29-2.pdf]. The percentage content of P and K for the dry manure is ~0.7% [23M.K. Hasanuzzaman, U. Ahmed, K. Nahar, and N. Akhter, "Plant growth pattern, tiller dynamics and dry matter accumulation of wetland rice (Oryza sativa L.) as influenced by application of different manures", Nat. Sci., vol. 8, no. 4, pp. 1-10.http://www.e3journals.org/ cms/ articles/ 1411271518_Sohail%20et%20al.pdf, 28S Akhtar, S Shakeel, A Mehmood, A Hamid, and S. Saif, Comparative analysis of animal manure for Soil conditioning. Int. J. Agron. Plant Prod. 2013; 4 (12): 3360-3365.] with an assumed 93% of moisture content for the digestate [21S. Kumar, L.C. Malav, M.K. Malav, and S.A. Khan, "Biogas Slurry: Source of Nutrients for Eco-friendly Agriculture", Int. J Ext Res., vol. 2, pp. 42-46.].
2.5. GHG Emissions Associated to the Reference Flows
The biogas generated in the managed manure system can benefit the households in several ways. This study has focused on the first dominant benefit which is cooking; therefore, it is required to take into account the realistic reference systems that would otherwise be replaced.
In rural areas, more than 93% of the households use traditional fuels for cooking, mainly wood fuel (~53%), manure cake (~18%), and crop residues (~21%) [29U.K. Mirza, N. Ahmad, and T. Majeed, "An overview of biomass energy utilization in Pakistan", Renew. Sustain. Energy Rev., vol. 12, pp. 1988-1996.
[http://dx.doi.org/10.1016/j.rser.2007.04.001] , 4P. Bojesson, and M. Maria Berglund, "Environmental systems analysis of biogas systems - Part II: The environmental impact of replacing various reference systems", Biomass Bioenergy, vol. 31, pp. 326-344.
[http://dx.doi.org/10.1016/j.biombioe.2007.01.004] , 30WHO (World Health Organization), 2005. Situation Analysis of Household Energy Use and Indoor Air Pollution in Pakistan. WHO/FCH/CAH/05.06. Retrieved on 20.05.2015 from http://whqlibdoc.who.int/hq/2005/WHO_FCH_CAH_05.06.pdf.]. Biogas will substitute these biogenic sources, and therefore, for achieving a right GHG emission balance, the emissions of CO2, CH4 and N2O of these fuels and those of biogas is estimated through the IPCC emissions factors [16 IPCC, 2006C. IPCC Guidelines for National Greenhouse Gas Inventories. Volume 2: Energy.] and the stationary combustion biomass under related IPCC categories [31 NIR, 2014: Memo item on CO2 emissions from biomass including 1A1, 1A2, 1A4: CH4 and N2O emissions from the stationary combustion of biomass.]. The emissions of reference flows are estimated in Table 4.
Around 0.2 to 0.4 m3 biogas per capita per day is sufficient for cooking in Pakistan [20A.S. Munawar, "Renewable energy resource potential in Pakistan", Renew. Sustain. Energy Rev., vol. 13, pp. 2696-2702.
[http://dx.doi.org/10.1016/j.rser.2009.06.029] ]. The factor varies with the household size. From the neighboring country’s experience like India, with an average rural household size of 5.5, about 0.23 m3 capita-1 day-1 of biogas can satisfy the cooking demand of the rural communities [32IARC (International Agency for Research on Cancer). World Health Organization. Household Use of Solid Fuels and High-temperature Frying 2010; 95. Retrieved on 24,05,2015 from http://monographs.iarc.fr/ENG/Monographs/vol95/mono95.pdf.]. For the average household size of Punjab’s rural areas as 6.5 [33A.W. Bhutto, A.W.A. Bazmi, and G. Zahedib, "Greener energy: Issues and challenges for Pakistan: Biomass energy prospective", Renew. Sustain. Energy Rev., vol. 15, pp. 3207-3219.
[http://dx.doi.org/10.1016/j.rser.2011.04.015] ], the study has assumed 0.27 m3 capita-1 day-1 of biogas for cooking. On the considerations above, each rural household in Punjab will need averagely 3.5 kg of wood, 1.6 kg of dung and 2.4 kg of crop residues to fulfill the daily energy demand for cooking. The substituted biomass fuels and their avoided GHG emissions are accordingly calculated.
3. RESULTS AND DISCUSSION
Using the method explained in sections 2.1 and 2.2, and the information on fuel demand for cooking in rural Punjab (section 2.5), Table 5 presents the average specific rates of manure production and biogas potential for the functional unit of the study (1 kg fresh-manure AU-1 day-1, i.e., 365 kg fresh-manure AU-1 yr-1).
Taking into account the design parameters of biogas production in section 2.2 and Table 2, each kg of fresh manure can produce ~0.04 m3 of biogas per day. This implies that each livestock household keeping cows (and buffaloes) in rural Punjab can not only produce around 576 m3 (and 624 m3) biogas per year, but also produce soil fertilizing nutrients from digestate. (see section 3.1). Averagely, the digestion of the available manure of a cow AU (and a buffalo AU) generates 92-111 m3 biogas per year (totally 4.3 billion-m3biogas yr-1) which satisfies ~70-88% of the cooking energy demand of the Punjab’s rural community.
3.1. Nutrient Trade-offs
The biogas digestate produces organic nutrients as the by-product which are considered as environmental friendly biofertilizers necessary for the plant growth [21S. Kumar, L.C. Malav, M.K. Malav, and S.A. Khan, "Biogas Slurry: Source of Nutrients for Eco-friendly Agriculture", Int. J Ext Res., vol. 2, pp. 42-46.]. The nutrient trade-offs of the two management systems are comparatively shown in Fig. (2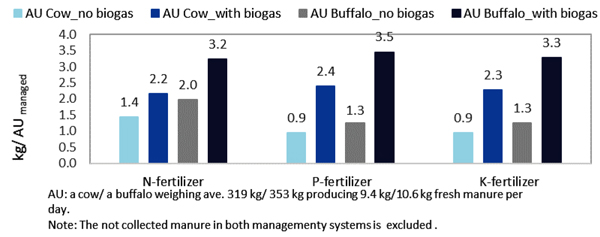 ). The result shows that averagely, each kg fresh cow’s manure (and buffalo’s manure) fed into the digester produces ~0.12 (and 0.14 kg) dry digestate. Taking into account the percentage content of the total nitrogen, phosphorous, and potassium of the manure and of the digestate in section 2.4, and considering 20% loss of digestate slurry, the relative level of these three organic nutrients for the two manure management systems with and without biogas generation is shown in Fig. (1).
 |
Fig. (2) Comparing NPK nutrient credits in manure management with and without biogas production. |
The alternative biogas generation takes advantage of digesting the quantity of the manure which would otherwise be burnt for fuel in the traditional management. It is estimated that, in overall, there would be 51%-63% of additional N, 154%-176% of additional P, and 142%-162% of additional K (depending on the type of AU-cow or AU-buffalo) for the rural community. For the case study of Punjab where each household (HH) averagely holds 6.1 AU of cows and 5.5 AU of buffaloes, there would be annual extra amounts of about ~182 kt NPK available for the whole Punjab’s households if biogas management is practiced. Most of the soils in Pakistan are poor in nutrient availability for optimal crop productivity, and the calcareous nature of soils has caused a low phosphorous P fertility [34H Nazli, SH Haider, S Hausladen, A Tariq, H Shafiq, S Shahzad, A Mehmood, A Shahzad, and E Whitney, Pakistan Rural Household Panel Survey 2012 (Round 1): Household Characteristics.]. The considerable higher NPK potential from biogas digestion would likely contribute to overcome the nutrient deficiency especially for phosphorous.
The likely further indirect GHG reductions from the excess nutrient produced from digester is expected. For instance, the mean yield of maize grain has increased when the plant is treated with biogas slurry as compared to the treatment with farmyard manure [35M. Ashraf, F.A. Tahir, M. Nasir, M. Bilal-Khan, and F. Umer, "Distribution and indexation of plant available nutrients of district layyah, Punjab Pakistan", Am. J. Agri., vol. 3, no. 2, pp. 16-20.
[http://dx.doi.org/10.11648/j.ajaf.20150302.11] ]. The application of stabilized digestate is assumed to be less harmful and more environmental benign [36A. Nasir, M. Mahmood Riaz, and M.A. Khan, "Comparative study of biogas slurry with farmyard manure as fertilizer on maize crop," Sci.Int (Lahore),22(4),297-301. , 37CT Lukehurst, P Frost, and T Al-Seadi, IEA Bioenergy- Task 37: Utilisation of digestate from biogas plants as biofertiliser 2010. Memo item on CO2 emissions from biomass.] while the farmyard manure may contaminate the environment with a relatively higher content of heavy metals if not managed properly [38H. Insam, M. Gómez-Brandón, and J. Ascher, "Manure-based biogas fermentation residues - Friend or foe of soil fertility?", Soil Biol. Biochem., vol. 84, pp. 1-14.
[http://dx.doi.org/10.1016/j.soilbio.2015.02.006] ]. Nevertheless, there is a lack of certainty in selecting the appropriate reference systems and in determining losses from crop uptake to identify these indirect impacts.
3.2. Carbon Footprint Trade-offs
The result of the life cycle GHG flows associated with the manure management with and without biogas generation is presented in Table 6.
The advantage of around 50% overall GHG reductions for alternative management system in Table 6 is due to the avoided traditional cooking fuel (wood, crop-residues and dung) which accounts for ~76% of the GHG emissions associated with the traditional management. The total life-cycle GHG reduction of the alternative manure management for biogas generation in the region could reduce around 18.7 million-t CO2 eq yr-1 (more than 7% of the total GHG emissions of the country). The savings of 17.7 (and 17.6) kg wood, and 11.9 (and 11.5) kg crop-residues per functional unit would potentially conserve 7.8 million-t wood and 5.2 million-t crop-residues per year. Moreover, there would be external societal benefits specially to women and children due to using a cleaner cooking fuel and saving the time and effort of gathering wood [1International Energy Agency. Energy access outlook from poverty to prosperity. World energy outlook special report 2017].
Another benefit of the alternative manure management is the electrification. The electricity access in rural Punjab is almost 80% which is rather high compared to other provinces in Pakistan; however, there are 621 un-electrified villages in the province [26P. Wallace, 2011. Digestates: Realizing the fertilizer benefits for crops and grassland. Project code: OAV036-210. Retrieved on 01.01.2015 from http://www.wrapcymru.org.uk/sites/files/wrap/Farmer%20guidance%20final%20-%20Cymru.pdf.]. The outrages in some rural areas causes the electricity cut even up to 12 to 20 hours per day. The estimated saved wood-fuel and crop residues can potentially be used for electricity generation, thus reducing the electricity supply shortage for the rural regions. Considering the LHV of wood and crop residues in Table 4, and assuming an electricity efficiency of 25% and 7000 operation hours of the plant, the total annual power generation from the saved local biomass sources for each district can be estimated. The potential electricity capacity could be of minimum 8 MW in Islamabad up to maximum 119 MW in Jhang, with a total potential of 1.9 GW electricity for the whole rural communities. Taking into account that Pakistan is highly dependent on fossil fuel for electricity production, further indirect GHG reductions is expected. However, the true credit depends on the logistic conditions and the local markets which deserve to be investigated in a future study.
The biogas loss (leakage) not only reduces the energy efficiency [4P. Bojesson, and M. Maria Berglund, "Environmental systems analysis of biogas systems - Part II: The environmental impact of replacing various reference systems", Biomass Bioenergy, vol. 31, pp. 326-344.
[http://dx.doi.org/10.1016/j.biombioe.2007.01.004] ], but also contributes significantly to the GHG emissions. Results in Table 6 indicate that, averagely, a ten percent biogas leakage accounts for almost 23% of the total life-cycle GHG emissions from biogas digestion. It also reduces the local biomass sources by ~10% (not shown in the table). A high biogas leakage of 40% from family biogas plants in rural developing countries is not very unlikely [12S Bruun, SL Jensen, VTK Vu, and S. Sommer, Small-scale household biogas digesters: An option for global warming mitigation or a potential climate bomb? 2014. Renewable and Sustainable Energy Reviews; 33: 736–741.
[http://dx.doi.org/10.1016/j.rser.2014.02.033] ]. In the study, a biogas loss of greater than 38% could result in an overall GHG emission rather than a GHG reduction. Notably, the biogas leakage is a critical bottleneck in achieving sustainability in the alternative manure option.
While efforts have been made to investigate the economic valuation of manure-to-biogas in rural developing communities [22ADB (Asian Development Bank) Energy access assessment Punjab (Pakistan). ADB energy for all program. Final report 2014: http://www.energyforall.info/wp-content/uploads/2012/07/Punjab-Energy-Access-Assessment-Report-Final.pdf. , 40GIZ (Deutsche Gesellschaft für Internationale Zusammenarbeit). Techno-economic feasibility study for biogas system application using cattle farm waste Punjab province–Pakistan 2013. Retrieved on 20.05.2015 from http:// energy.punjab.gov.pk/ downloads/Revised%20Techno - economic%20Feasibility%20Study_ Punjab_08%2002%202013%20.pdf.], this study has identified certain favorable conditions and limitation of manure-to-soil and manure-to-biogas.
CONCLUSION
In this research study, the IPCC and LCA methods are integrated to assess the environmental life-cycle GHG emissions and nutrient productions of the traditional manure management and alternative manure-to-biogas for a case study in rural Punjab. The great advantage of 50% GHG reductions (12.8 million-t CO2-eq yr-1) of manure conversion to biogas is mainly due to the avoided emissions from wood, crop-residues and dung used as cooking fuels in the region. There would be a significant higher NPK nutrient potential from converting manure to biogas compared to the traditional manure management with no biogas production.
A 10% biogas loss would account for the 23% of GHG emissions, and can deplete the overall greenhouse savings if reaches to around 38%. Therefore, it is the driver and bottleneck of the environmental sustainability performance of family size manure biogas plants.
The study may contribute to understanding the life cycle environmental performance of different components included in manure management for supporting the sustainability promotion of this option for the benefits of rural communities.
NOTES
1 On this basis, the daily biogas rate would be 0.35 m3 kgVS-1 for cows, and 0.32 m3 kgVS-1 for buffaloes in summer (days with average temperature of >26 ºC) and 30% less for winter temperature (days with average temperature of 15 ºC)
CONSENT FOR PUBLICATION
Not applicable.
CONFLICT OF INTEREST
The authors declare no conflict of interest, financial or otherwise.
ACKNOWLEDGEMENTS
Declared none.
REFERENCES
| [1] | International Energy Agency. Energy access outlook from poverty to prosperity. World energy outlook special report 2017 |
| [2] | J. Yang, and B. Chen, "Emergy analysis of a biogas-linked agricultural system in rural China: A case study in Gongcheng Yao Autonomous County", Appl. Energy, vol. 118, pp. 173-182. [http://dx.doi.org/10.1016/j.apenergy.2013.12.038] |
| [3] | L. Yu, K. Yaoqiu, H. Ningsheng, W. Zhifeng, and X. Lianzhong, "Popularizing household-scale biogas digesters for rural sustainable energy development and greenhouse gas mitigation", Renew. Energy, vol. 33, no. 9, pp. 2027-2035. [http://dx.doi.org/10.1016/j.renene.2007.12.004] |
| [4] | P. Bojesson, and M. Maria Berglund, "Environmental systems analysis of biogas systems - Part II: The environmental impact of replacing various reference systems", Biomass Bioenergy, vol. 31, pp. 326-344. [http://dx.doi.org/10.1016/j.biombioe.2007.01.004] |
| [5] | C. Opio, P. Gerber, A. Mottet, A. Falcucci, G. Tempio, M. MacLeod, T. Vellinga, B. Henderson, and H. Steinfeld, Greenhouse gas emissions from ruminant supply chains – A global life cycle assessment 2013. Food and Agriculture Organization of the United Nations (FAO), Rome. |
| [6] | D. Caro, S.J. Davis, S. Bastianoni, and K. Caldeira, Global and regional trends in greenhouse gas emissions from livestock. Clim. Chang., doi 10.1007/s10584-014-1197-x. |
| [7] | A. Meyer-Aurich, A. Alexander Schattauer, H.J. Hellebrand, H. Klauss, M. Plöchl, and W. Berg, "Impact of uncertainties on greenhouse gas mitigation potential of biogas production from agricultural resources", Renew. Energy, vol. 37, no. 1, pp. 277-284. [http://dx.doi.org/10.1016/j.renene.2011.06.030] |
| [8] | D. Chadwick, S. Sommer, R. Thorman, D. Fangueiro, L. Cardenas, B. Amon, and T. Misselbrook, "Manure management: Implications for greenhouse gas emissions", Anim. Feed Sci. Technol., vol. 166–167, pp. 514-531. [http://dx.doi.org/10.1016/j.anifeedsci.2011.04.036] |
| [9] | C. Nzila, J. Dewulf, H. Spanjers, D. Tuigong, H. Kiriamiti, and H. van Langenhove, "Multi criteria sustainability assessment of biogas production in Kenya", Appl. Energy, vol. 93, pp. 496-506. [http://dx.doi.org/10.1016/j.apenergy.2011.12.020] |
| [10] | M.V. Dael, S.V. Passel, L. Pelkmans, R. Guisson, P. Reumermann, N.M. Luzardo, N. Witters, and J. Broeze, "A techno-economic evaluation of a biomass energy conversion park", Appl. Energy, vol. 104, pp. 611-622. [http://dx.doi.org/10.1016/j.apenergy.2012.11.071] |
| [11] | L. Hamelin, I. Naroznova, and H. Wenze, "Environmental consequences of different carbon alternatives for increased manure-based biogas", Appl. Energy, vol. 114, pp. 774-782. [http://dx.doi.org/10.1016/j.apenergy.2013.09.033] |
| [12] | S Bruun, SL Jensen, VTK Vu, and S. Sommer, Small-scale household biogas digesters: An option for global warming mitigation or a potential climate bomb? 2014. Renewable and Sustainable Energy Reviews; 33: 736–741. [http://dx.doi.org/10.1016/j.rser.2014.02.033] |
| [13] | J.B. Holm-Nielsen, T. Al Seadi, and P. Oleskowicz-Popiel, "The future of anaerobic digestion and biogas utilization", Bioresour. Technol., vol. 100, no. 22, pp. 5478-5484. [http://dx.doi.org/10.1016/j.biortech.2008.12.046] [PMID: 19217772] |
| [14] | IPCC 2006a. Guidelines for National Greenhouse Gas Inventories. Volume 4: Agriculture, Forestry and Other Land Use. Chapter 10. Emissions from livestock and manure management. |
| [15] | IPCC, 2006b. Guidelines for National Greenhouse Gas Inventories. Volume 4: Agriculture, Forestry and Other Land Use. Chapter 11:N2O Emissions from Managed Soils, and CO2 Emissions from Lime and Urea Application. |
| [16] | IPCC, 2006C. IPCC Guidelines for National Greenhouse Gas Inventories. Volume 2: Energy. |
| [17] | S.K. Ranjhan, International Livestock Research Institute. Dairy cattle and buffalo. Retrieved on 06.04.2015 from http://www.ilri.org/InfoServ/Webpub/fulldocs/SmHDairy/chap7.html#Feeding. |
| [18] | S. Heiske, L. Jurgutis, and K. Zsófia, "Evaluation of novel inoculation strategies for solid state anaerobic digestion of Yam peelings in low-tech digesters", Energies, vol. 8, pp. 1802-1816. [http://dx.doi.org/10.3390/en8031802] |
| [19] | Kausar & Muller, 1983. Review on recycling of animal wastes as a source of nutrients for freshwater fish culture within an integrated livestock system. UNDP/FAO Project PAK/80/019. Retrieved on 15.05.2015 from http:// www.fao.org/docrep/ field/ 003/ ac526e/ ac526e02.html. |
| [20] | A.S. Munawar, "Renewable energy resource potential in Pakistan", Renew. Sustain. Energy Rev., vol. 13, pp. 2696-2702. [http://dx.doi.org/10.1016/j.rser.2009.06.029] |
| [21] | S. Kumar, L.C. Malav, M.K. Malav, and S.A. Khan, "Biogas Slurry: Source of Nutrients for Eco-friendly Agriculture", Int. J Ext Res., vol. 2, pp. 42-46. |
| [22] | ADB (Asian Development Bank) Energy access assessment Punjab (Pakistan). ADB energy for all program. Final report 2014: http://www.energyforall.info/wp-content/uploads/2012/07/Punjab-Energy-Access-Assessment-Report-Final.pdf. |
| [23] | M.K. Hasanuzzaman, U. Ahmed, K. Nahar, and N. Akhter, "Plant growth pattern, tiller dynamics and dry matter accumulation of wetland rice (Oryza sativa L.) as influenced by application of different manures", Nat. Sci., vol. 8, no. 4, pp. 1-10.http://www.e3journals.org/ cms/ articles/ 1411271518_Sohail%20et%20al.pdf |
| [24] | M. Irshad, A.E. Enej, Z. Hussain, and M. Ashraf, "Chemical characterization of fresh and composted livestock manures", J. Soil Sci. Plant Nutr., vol. 13, no. 1, pp. 115-121. |
| [25] | A. Yadav, R. Gupta, and V.K. Garg, "Organic manure production from cow dung and biogas plant slurry by vermicomposting under field conditions", Int. J. Recycl. Org. Waste Agric., vol. 2, pp. 21-28. [http://dx.doi.org/10.1186/2251-7715-2-21] |
| [26] | P. Wallace, 2011. Digestates: Realizing the fertilizer benefits for crops and grassland. Project code: OAV036-210. Retrieved on 01.01.2015 from http://www.wrapcymru.org.uk/sites/files/wrap/Farmer%20guidance%20final%20-%20Cymru.pdf. |
| [27] | M. Yasin, and M. Wasim, "Aanaerobic digestion of buffalo dung, sheep waste and poultry litter for biogas production", J. Agric. Res. (Lahore), vol. 49, pp. 1-10.http://www.jar.com.pk/upload/1374663342_88_35__73Paper-9-JAR-49%281%29-2.pdf |
| [28] | S Akhtar, S Shakeel, A Mehmood, A Hamid, and S. Saif, Comparative analysis of animal manure for Soil conditioning. Int. J. Agron. Plant Prod. 2013; 4 (12): 3360-3365. |
| [29] | U.K. Mirza, N. Ahmad, and T. Majeed, "An overview of biomass energy utilization in Pakistan", Renew. Sustain. Energy Rev., vol. 12, pp. 1988-1996. [http://dx.doi.org/10.1016/j.rser.2007.04.001] |
| [30] | WHO (World Health Organization), 2005. Situation Analysis of Household Energy Use and Indoor Air Pollution in Pakistan. WHO/FCH/CAH/05.06. Retrieved on 20.05.2015 from http://whqlibdoc.who.int/hq/2005/WHO_FCH_CAH_05.06.pdf. |
| [31] | NIR, 2014: Memo item on CO2 emissions from biomass including 1A1, 1A2, 1A4: CH4 and N2O emissions from the stationary combustion of biomass. |
| [32] | IARC (International Agency for Research on Cancer). World Health Organization. Household Use of Solid Fuels and High-temperature Frying 2010; 95. Retrieved on 24,05,2015 from http://monographs.iarc.fr/ENG/Monographs/vol95/mono95.pdf. |
| [33] | A.W. Bhutto, A.W.A. Bazmi, and G. Zahedib, "Greener energy: Issues and challenges for Pakistan: Biomass energy prospective", Renew. Sustain. Energy Rev., vol. 15, pp. 3207-3219. [http://dx.doi.org/10.1016/j.rser.2011.04.015] |
| [34] | H Nazli, SH Haider, S Hausladen, A Tariq, H Shafiq, S Shahzad, A Mehmood, A Shahzad, and E Whitney, Pakistan Rural Household Panel Survey 2012 (Round 1): Household Characteristics. |
| [35] | M. Ashraf, F.A. Tahir, M. Nasir, M. Bilal-Khan, and F. Umer, "Distribution and indexation of plant available nutrients of district layyah, Punjab Pakistan", Am. J. Agri., vol. 3, no. 2, pp. 16-20. [http://dx.doi.org/10.11648/j.ajaf.20150302.11] |
| [36] | A. Nasir, M. Mahmood Riaz, and M.A. Khan, "Comparative study of biogas slurry with farmyard manure as fertilizer on maize crop," Sci.Int (Lahore),22(4),297-301. |
| [37] | CT Lukehurst, P Frost, and T Al-Seadi, IEA Bioenergy- Task 37: Utilisation of digestate from biogas plants as biofertiliser 2010. Memo item on CO2 emissions from biomass. |
| [38] | H. Insam, M. Gómez-Brandón, and J. Ascher, "Manure-based biogas fermentation residues - Friend or foe of soil fertility?", Soil Biol. Biochem., vol. 84, pp. 1-14. [http://dx.doi.org/10.1016/j.soilbio.2015.02.006] |
| [39] | A. Gattinger, J. Jawtusch, and A. Muller, Mitigating Greenhouse Gases in Agriculture. A challenge and opportunity for agricultural policies 2011. Published by: Diakonisches Werk der EKD e.V., Germany. Retrieved on 26.05.2015 from http://orgprints.org/19989/1/gatti.pdf. |
| [40] | GIZ (Deutsche Gesellschaft für Internationale Zusammenarbeit). Techno-economic feasibility study for biogas system application using cattle farm waste Punjab province–Pakistan 2013. Retrieved on 20.05.2015 from http:// energy.punjab.gov.pk/ downloads/Revised%20Techno - economic%20Feasibility%20Study_ Punjab_08%2002%202013%20.pdf. |