- Home
- About Journals
-
Information for Authors/ReviewersEditorial Policies
Publication Fee
Publication Cycle - Process Flowchart
Online Manuscript Submission and Tracking System
Publishing Ethics and Rectitude
Authorship
Author Benefits
Reviewer Guidelines
Guest Editor Guidelines
Peer Review Workflow
Quick Track Option
Copyediting Services
Bentham Open Membership
Bentham Open Advisory Board
Archiving Policies
Fabricating and Stating False Information
Post Publication Discussions and Corrections
Editorial Management
Advertise With Us
Funding Agencies
Rate List
Kudos
General FAQs
Special Fee Waivers and Discounts
- Contact
- Help
- About Us
- Search


The Open Medical Informatics Journal
(Discontinued)
ISSN: 1874-4311 ― Volume 13, 2019
A Cellular Automaton Framework for Infectious Disease Spread Simulation
Bernhard Pfeifer*, 1, Karl Kugler2, Maria M Tejada1, Christian Baumgartner1, Michael Seger1, Melanie Osl1, Michael Netzer1, Michael Handler1, Andreas Dander1, Manfred Wurz3, Armin Graber2, Bernhard Tilg1
Abstract
In this paper, a cellular automaton framework for processing the spatiotemporal spread of infectious diseases is presented. The developed environment simulates and visualizes how infectious diseases might spread, and hence provides a powerful instrument for health care organizations to generate disease prevention and contingency plans. In this study, the outbreak of an avian flu like virus was modeled in the state of Tyrol, and various scenarios such as quarantine, effect of different medications on viral spread and changes of social behavior were simulated.
The proposed framework is implemented using the programming language Java. The set up of the simulation environment requires specification of the disease parameters and the geographical information using a population density colored map, enriched with demographic data.
The results of the numerical simulations and the analysis of the computed parameters will be used to get a deeper understanding of how the disease spreading mechanisms work, and how to protect the population from contracting the disease. Strategies for optimization of medical treatment and vaccination regimens will also be investigated using our cellular automaton framework.
In this study, six different scenarios were simulated. It showed that geographical barriers may help to slow down the spread of an infectious disease, however, when an aggressive and deadly communicable disease spreads, only quarantine and controlled medical treatment are able to stop the outbreak, if at all.
Article Information
Identifiers and Pagination:
Year: 2008Volume: 2
First Page: 70
Last Page: 81
Publisher Id: TOMINFOJ-2-70
DOI: 10.2174/1874431100802010070
Article History:
Received Date: 18/1/2008Revision Received Date: 27/3/2008
Acceptance Date: 9/4/2008
Electronic publication date: 24/4/2008
Collection year: 2008
open-access license: This is an open access article distributed under the terms of the Creative Commons Attribution License (http://creativecommons.org/license/by/2.5/), which permits unrestrictive use, distribution, and reproduction in any medium, provided the original work is properly cited.
* Address correspondence to this author at the Institute of Biomedical Engineering, University for Health Sciences, Medical Informatics and Technology, Austria; E-mail: bernhard.pfeifer@umit.at
| Open Peer Review Details | |||
|---|---|---|---|
| Manuscript submitted on 18-1-2008 |
Original Manuscript | A Cellular Automaton Framework for Infectious Disease Spread Simulation | |
INTRODUCTION
Infectious diseases, which are also known as communicable diseases, kill more people worldwide than any other single cause. An individual can be infected by e.g. touching, eating, breathing, and sexual contact and furthermore, an individual can contract a germ responsible for a disease from an animal. The class of germs or vectors can be divided into four main groups: bacteria, viruses, fungi and protozoa.
Through history several endemic and even pandemic situations occurred. For example, the plague from 1347 to 1352 killed over 25 million people in Europe, which was about a third of the European population. The next occurrence of the plague from 1896 to 1945 was spreading over the whole world and killed about 12 million people. In the years 1918 to 1920 the pandemic of the Spanic Flu killed at least 20 million up to 50 million individuals. The Asian Flu in the year 1957 killed about one million and the Hongkong Flu about 700.000 individuals. AIDS is known since about 1980, which killed over 20 million individuals. There are more than 40 million individuals infected, and due to the incautiousness and the immense belief in modern medicine, the spread of AIDS and other infectious diseases is still going on [1World Health Organization (WHO). Available fromhttp://www. who.int. ]. It is worth mentioning that about 90 percent of the death from infectious diseases worldwide is caused by only a small number of diseases. More about historical facts can be found in [1World Health Organization (WHO). Available fromhttp://www. who.int. ].
The simulation of disease spreading over a population is vitally important in order to build a contingency plan for the sake of common welfare and for getting a better understanding how the dynamics of disease spreading works. The proposed framework is based on a cellular automaton framework that enables the simulation of different diseases by parametrizing the general model with individual disease parameters, geographical structures, and population densities. Cellular automata for simulating infectious diseases can be used to discover the behavior of the disease or to work out contingency plans. Specialized models for different diseases have been presented in the past [2Xiao X, Shao SH, Chou KC. A probability cellular automaton model for hepatitis b viral infections Biochem Biophys Res Commun 2006; 342: 605-15.-11Aschwanden C. Spatial simulation model for infectious viral diseases with focus on SARS and the common flu In: Proceedings of the 37th Hawaii International Conference on Systems Sciences; Dec 2004; (HICSS'04) Track 6 Vol 6]. Our proposed framework, however, is able to simulate different infectious disease types and allows the use of different geographical maps with marked population densities and enables the modeler to change the behavior of the individuals during the spread. Furthermore, it allows changing parameters (medication, quarantine, birth rate, death rate, virus morbidity, et cetera) during the simulation process in order to obtain realistic results. The parameters of each individual are accessible at every time step of the simulation, which facilitates the exploration of data patterns using statistics and data mining approaches.
METHOD
When trying to model the spread of infectious diseases the classic epidemic model is widely used [12Hethcote HW. The mathematics of infectious diseases Society for Industrie and Applied Mathematics (SIAM review) 2000; 42: 599-653.]. This epidemic modeling approach is known as S-I-R model, where the class S denotes the number of susceptibles, class I denotes the number of infectives and class R denotes the number of recovered people with immunity. The SIR model given by the initial value problem can be formulated as
where S(t), I(t), and R(t) are the numbers of the model classes so that S(t)+I(t)+R(t)=N, with N being the number of all individuals. β represents the contact rate and 1/γ is the average infectious period. However, the classic SIR model is not sufficient in modeling natural birth, natural death, immigration, emigration and passive immunity, which occurs because infants carry maternal antibodies for a specified time. For that reason, the classic SIR model was adapted and more classes and parameters were added to the model [13Getz W, Lloyd-Smith J, Cross P, et al. Modeling the invasion and spread of contagious diseases in heterogenous populations Disease evolution Models concepts and data analyses In: Feng Z, Dieckmann U, Levin SA, Eds. Discrete Mathematics and Theoretical Computer Science AMS/DIMACS 2005; 71: 113-44.,14Getz W, Lloyd-Smith J. Basic methods for modeling the invasion and spread of contagious diseases Disease evolution Models concepts and data analyses In: Feng Z, Dieckmann U, Levin SA, Eds. Discrete Mathematics and Theoretical Computer Science AMS/DIMACS 2007; 71: 87-109.].
When using a SIR or an extended SIR model [7Eliades DG, Symeonidis AL, Mitkas PA. Genecity A multi agent simulation environment for hereditary diseases Computer Systems and Applications 2006; 8: 529-36.] for simulating the spread of a disease, one faces the problem of being unable to integrate geological and demographic realities into the model. Therefore, a cellular automaton (CA) can be used to tackle this problem. The development of a CA approach was the target of our research activity. A CA is a dynamical system in which space and time is discrete [15Deutsch A, Dorman S. Cellular Automaton Modeling of Biological Pattern Formation In: ISBN 0-8176-4281-1 Birkhäuser. 2005.]. In general a CA is specified by a regular discrete lattice of cells and boundary conditions, a finite set of states, a finite set of cells that defines the interaction neighborhood and a state transition rule that determines the dynamics of the states of the cells. A CA consists of cells, which have a finite number of neighbor cells; each of those is in one of the defined finite states. Each cell is updated by a state transition function synchronously in discrete time steps. A CA can be formally described as an 8-tuple:
where
Z = cell configuration,
N represents the neighborhood and Σ the input alphabet, Q is the finite number of states, δ is the state transition function, σ is the output function, Q0 represents the initial start state and F the finite automaton state, respectively.
Cellular Automaton Framework
The framework has been developed using the platform independent programming language Java Version 5.0 [16SUN developer network (SDN) Available from: http://java.sun. com ]. It consists of five general classes describing a CA in an abstract way. These classes have to be derived in order to build a specialized simulation model. The classes are:
- CellularAutomaton: an abstract class that defines a cellular automaton. The method compute() has to be called in order to perform one simulation step. The main function of this method is to iterate trough all cells in the cellular automaton and to call the state transition function δ.
- Cell: this abstract class implements the general behaviors of a cell participating in the cellular automaton model. Each cell has a unique index, properties and the abstract method named performCellAction(), which is the state transition function δ. Furthermore, there are some additional methods defining the neighborhood, which can be altered at runtime, too. Therefore, a Cell Object represents an area of the geographical model, where a finite number of individuals is placed.
- CellProperty: Each cell in the model has different properties. This class defines standard cell properties that have to be adapted when implementing a specialized model.
- AutomatonDimension: a CA can be defined in different dimensions (e.g.: 1D, 2D, 3D); when generating a cellular automaton object using the CellularAutomaton class the AutomatonDimension class is used in order to define the dimensionality of the CA model.
- Coordinate: this class includes some helper functions for calculating the index from given 2D or a 3D coordinates; this is needed because each cell in the automaton has a unique index, and is stored using a one dimensional array; but the coordinates are easier to handle by defining them as x, y and z coordinates.
Geographic Model
For the simulation, the state Tyrol was chosen. Tyrol is one of nine states of Austria. Tyrol has 660.000 inhabitants, where about 115.000 inhabitants are living in the capital named Innsbruck, and a total area of 10.628 square kilometers. The area of settlement is about 1.600 square kilometers [17Tyrolean Government Available from: http://www.tirol.gv.at/. ]. Fig. (1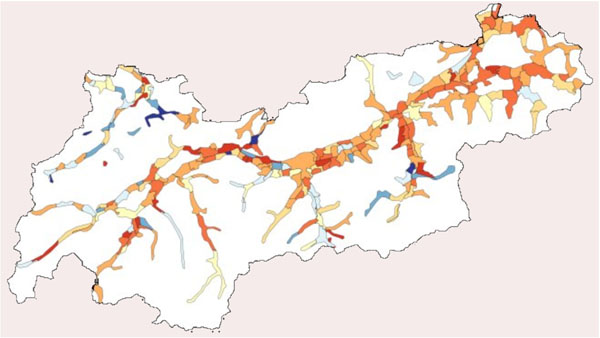 ) depicts the area of Tyrol and the population density using colors from white, light yellow up to red.

Disease Model
In the model the disease life cycle was implemented [7Eliades DG, Symeonidis AL, Mitkas PA. Genecity A multi agent simulation environment for hereditary diseases Computer Systems and Applications 2006; 8: 529-36.]. The life cycle follows five different phases:
- Latent period: during early stages of an infection the virus is developing the ability to transfer to a new host.
- Infectious period: in this period the germ is contagious and can be transferred to a susceptible host.
- Recovered or removed: there are two possible outcomes for a host. On the one hand the host dies and is therefore removed from the population and is no longer contagious, and on the other hand the host gets immune.
- Incubation period: when a host gets infected there are often no visible signs that an infection occurred. During this and the overlapping appearance of the infectious period the infectious disease spreads the most.
- Symptomatic period: in this phase there are visible signs of infection. Therefore, in this period the individuals call a doctor, and moreover, in this phase it is possible to quarantine the individual.
Each individual in the model has the following state parameters:
- Individual state class: SUSCEPTIBLE, INFECTIVE, REMOVAL and IMMUNE
- Individual age class: KID, TEEN, ADULT, ELDERLY
- Treatment class: MEDICAL-TREATMENT-1, MEDICAL-TREATMENT-2, NO-TREATMENT
- Arrangements for symptomatic and diseased individuals: NORMAL, QUARANTINE
- Movement of the individual: MOVE, NOMOVE
The overall simulation world and disease parameters are:
- Natural birth rate and natural death rate: these two parameters control the natural birth and death rate in the population. The two parameters are coupled with the individual age classes in a way that only teens and adults are able to have babies and furthermore, the probability to die is also weighted with the age class (elderly individuals have a higher probability to die than kids e.g.).
- Disease morbidity rate: this parameter controls the fatality rate of the disease. In addition, this parameter is coupled with the treatment class. The probability to survive the infection is higher when a medical treatment is set.
- Spontaneous infection rate: sometimes infection occurs with no possibility to bring the elicitor to light. By using this parameter such behavior can be simulated.
- Vectored infection rate: this parameter is known as the natural spreading mechanism across cells.
- Contact infection rate: this parameter controls how susceptible individuals are to infection through contact to infected individuals.
- Movement probability: individuals have the permission to switch between cells. This parameter controls the probability of an individual to switch between neighbored cells. This parameter is also coupled with the age class (TEEN and ADULT do travel the most), the disease arrangement class (QUARANTINE individuals are not allowed to switch between cells), and movement class of the individuals (MOVE or NOMOVE).
- Immigration rate: these parameters control if the area model is opened or closed. If an individual immigrates into the area then the individual state class (SIR) is set by taking the spontaneous infection rate parameter into account.
- Susceptible again rate: if an individual survives the infection then the individual is immune for a defined count of days. This parameter controls how long a temporarily immune individual stays in state immune before having the chance to get infected again.
State Transition Function δ
The algorithm iterates through each cell of the CA. Each cell represents a small area of Tyrol and performs the operations of the n individuals placed in the cell. The spatial dimension n in the used model consists of 121.730 pixels. Therefore, one pixel in the model represents 87.307 square meters of the state Tyrol. For that reason, the framework provides the performCellAction() method, which computes the next discrete time step of observation. The operations are as following:
- Handle the natural death cases
- Handle the natural birth cases
- Compute death caused by the disease
- Compute the immigrants
- Compute vectored infections
- Compute contact infections
- Compute spontaneous infections
- Handle recovered individuals
- Handle re-susceptible
- Perform movement operations of the individuals
- Adapt parameters according specification
- Create output for actual time step
The steps (1-11) are performed until the specified number of time steps for the simulation is reached. During the simulation process snapshots of the actual distributions are created and furthermore, the data for subsequent statistical analysis is generated and stored.
RESULTS
The simulated infectious disease is similar to the avian flu, except for the imperative difference that this virtual virus can be transmitted between human beings directly with a relatively high likelihood (see Table 1). Therefore, this virtual form of the H5N1 avian flu virus can be considered as a dangerous mutation, which could have the power to effect an epidemic/pandemic situation. Table 1 depicts the parameters that have been used for the simulation experiment:

Eight different scenarios were simulated. The seed point of the infection was set to the capital Innsbruck. In the first scenario (scenario A), the disease spread in the state Tyrol where medical treatment was performed. Two different drugs are available for infected individuals. Drug one reduces the death rate by 55 percent whereas drug two reduces the death rate by 45 percent. The social behavior of the individuals changes during the simulation time, which would also occur in a real situation. When a fatal disease is circulating, individuals are very cautious contacting others in order to minimize their infection risk. The second scenario (scenario B) is similar to scenario A with the difference that no medical treatment is performed. Scenario C and D is equal to A and B with the difference that there is no adaptation of the social behavior. Scenario E and F is equal to scenario A and B with the difference that after 50 time steps (about 2 month) a strictly controlled quarantine is introduced. In the last two scenarios (An, Bn), the same simulation parameters were applied as in A and B with the difference that no geographical and population density was used. Therefore, each cell covers the mean number of individuals from the state Tyrol model. By comparing these scenarios with A and B it is possible to find out the relevance of geographical (natural barriers) and population density information. The results are presented in Fig. (2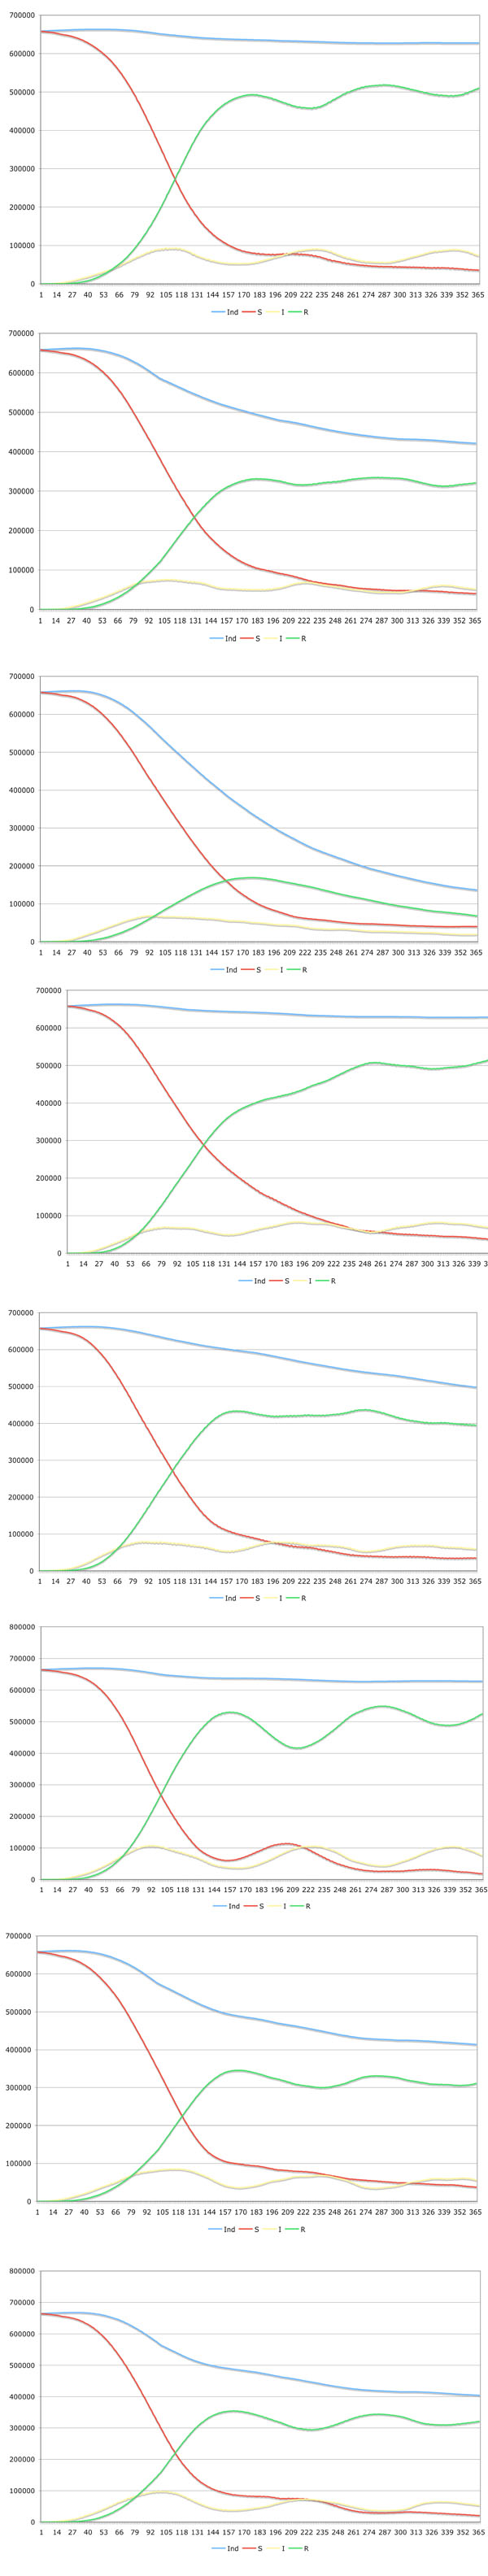 ).
).

The simulation showed that the geographic structure of the area is of importance as natural barriers slow down the velocity of the spread. A slower velocity coupled with the change of the natural behavior of the individuals helps to reduce cases of death.
Because in this simulation the temporary immunity was set to 100 days, the figures show a periodicity with decreasing amplitude.
Fig. (3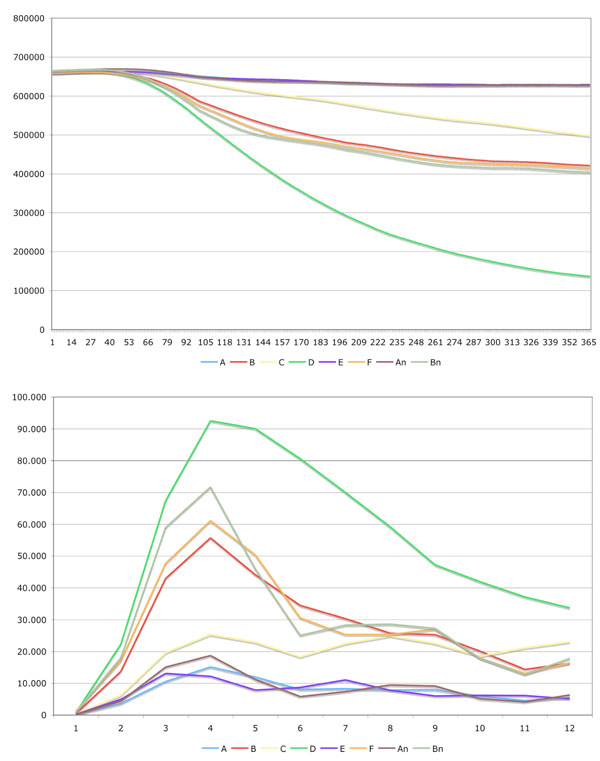 ) shows the changes in population and the number of individuals killed by the disease in the different scenarios.
 |
Fig. (3) In the left image the changes in population over the time are depicted. The right image shows the death cases caused by the communicable disease aggregated per month. |
As a cellular automaton has a cellular space or cellular lattice, these models allow the visualization of the automaton states at each time point. The regular lattice
where N is the interaction neighborhood template, b is the coordinate number, r is the position of the cell and ci denotes the interacting neighbors. In our case a Moore neighborhood instead of a von-Neumann neighborhood or 2-radial neighborhood was taken for the simulation. When simulating the scenarios using a 2-radial or von-Neumann neighborhood the graphical representation is smoother and ringlike compared to the presented ones, but the overall behavior is almost equal. Furthermore, the framework allows modeling far away neighborhoods like airports, but in this Tyrol state simulation these neighborhood relations were neglected to keep the model simple. When incorporating hubs like airports, and train stations this feature becomes important.
Fig. (4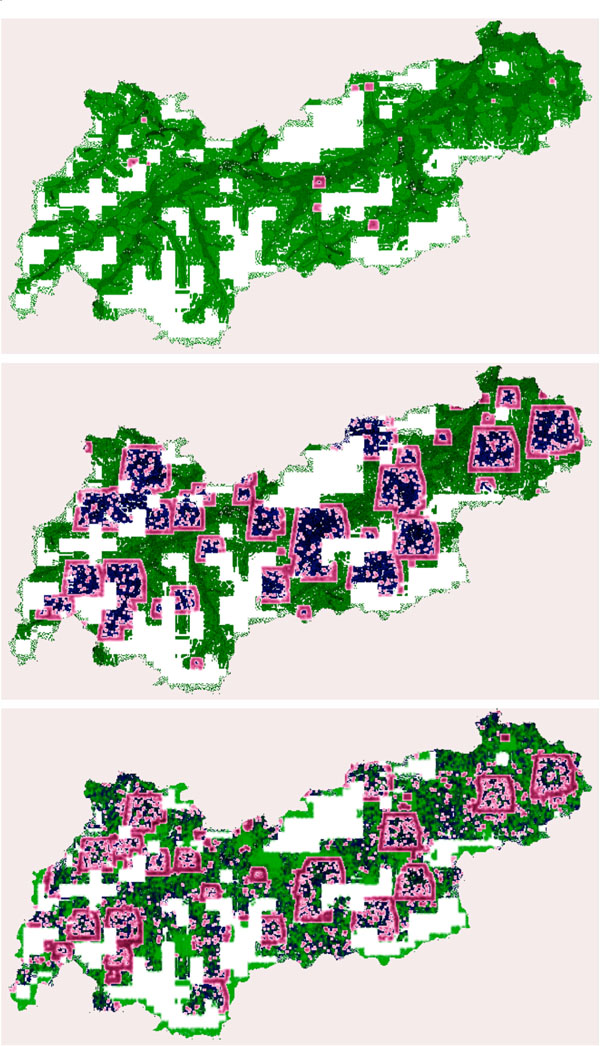 ) depicts the spatial results of the disease spread for scenario A. When analyzing the spreading, one can see that the geographical properties and the different densities in the valleys of Tyrol are responsible for slowing down the outbreak. But the geographical conditions are unable to stop the outbreak completely.

Analyzing one cell of the overall cellular automaton enables to get a deeper understanding in the dynamics of the simulation. Therefore, the cell at time point zero in which the disease spread started is picked. Fig. (5 ) shows the cell where one individual was infected. The individual 2, which is colored in gentle-pink suffers from the communicable disease. Due to this configuration it is possible that other individuals contacting the diseased individual may get infected, too. The individuals (1,2,3,5,6) and the individuals in the neighbor cells, who are moving from one to another cell, are able to get infected, which is calculated by using a random value. In this sample individual 2 and 5 got infected and are now in state infective (I) and furthermore, in the sub-state latent-period, where the virus is proliferating but unable to infect other individuals.

Each individual has a finite state automaton inside working, which is depicted in Fig. (6 ). An individual, when born is in state M, which means that the individual cannot be infected although exposed. After this temporary immunity is passed, the individual turns into state susceptible (S). When an individual is exposed, then there are two possibilities in this finite state machine. It can stay in state S, which means that no infection occurred although exposed, and on the other hand the individual can pass to the state infected (I). Inside the state I there is another finite state machine working, which computes the disease life cycle, which is described above. After having passed the disease life cycle the individual changes its state into removed (R). In this state the decision is made if the individual turns in state susceptible with temporary or partial immunity or is removed due to death. Furthermore, each individual independent of the actual state can make a transition to state dead due to natural death cases.
 |
Fig. (6) The finite state automaton working in each individual. For more information see text. (Arrow from R to M) |
The run time of the simulation was µ =51,87 minutes (σ =1,87) per scenario (simulation of 365 time steps per scenario) with four scenarios started parallel on the same machine. The simulation was performed using an Apple X-Serve 1.1 OS X Server Version 10.4.10 with 2 x 2 GHz Dual Core Intel Xeon processor and 2 GB of RAM installed. The mean storage per scenario was about 10 MB (spatiotemporal snapshots per time step and overall information). The maximum capacity of the framework is limited to 10 billion individuals, which is enough to simulate a spread of a disease over the whole globe; but the simulation time would be high.
DISCUSSION AND CONCLUSION
The proposed framework enables the simulation of different communicable diseases by specifying the disease parameters and demographic characteristics. Furthermore, the population can be divided into subgroups, which enables to simulated different impacts of the disease on each individual. The described scenarios demonstrated that cellular automata models can be used for simulating and visualizing the spread and the adherent impact of infectious diseases. Furthermore, the simulation environment allows the access to any individual parameter at any point in time of the simulation.
In the presented simulation run only Moore neighborhood was used because far away neighborhoods were neglected for the state Tyrol infection spread model. It is important to know that the possibility to model far away neighborhoods exists in the framework. Each unique index of a neighboring cell is stored in a vector in each cell.
Although the connections and the affiliated behavior between the individuals can be modeled using different neighborhood relations, the behavior of any individual in these models depends on a function using random numbers. The natural manner – let us call it “Groundhog Day” [18IMDb - the internet movie database Available from:http://imdb.com/title/tt0107048/ Groundhog Day] - that most individuals do have a way of living caused by their daily workflow, can not be modeled correctly, using such functions. In order to solve this problem one idea could be to use virtual worlds, like the well-known Second Life [19Second Life Available from:http://secondlife.com/ ], where millions of people do live an additional life and do also have a behavior, which is very similar compared to their own.
In order to model virtual population and their behavior being statistically not distinguishable from real population a census and demographic data integration approach will be implemented in future. For modeling various behavior scenarios of individuals different algorithms based on behavior strategies are developed. Therefore, each individual carries a meme list, and a list where the behaviors of known individuals or knowledge obtained through “grapevine” is stored in order to control the individuals’ behavior. Due to this information, the social status, the fads and fashions, and social norms interaction neighborhoods are modeled and implemented. All the raw data simulation results will then be stored in a data warehouse system for enabling further statistical analysis and business intelligence to understand the spreading mechanisms and how to intervene for minimizing the death toll and economic costs. Furthermore, the next step in our model will be to enable detailed social network modeling in a household. These members are direct contact persons, which have a high probability of interaction. The movement of the individuals generates new possible interactions. Although individuals being part in the same cell (building, transportation vehicle, shopping mall) the interaction probability depends on several factors, like e.g., job position. A collector in a shopping mall interacts with all individuals that buy something and have to pass through the collector for leaving the shop. The shopper in turn only has to interact with the collector, but not with other shoppers in the mall. This shopper-shopper interaction depends on the size of the store and a randomly estimated value computed incorporating meme values. The same remains true when using public transport. The longer the transportation, the more likely interaction between individuals happens. The interaction will be modeled by the meme list values and a computed random value. These further implementations will enable a more precise modeling and estimation of the overall diseases impact.
CA disease spread models do have the efficiency to help public health offices in creating strategy plans to manage fatal communicable diseases and the therewith associated health care costs as well as the dynamics and scenes arising in population.
REFERENCES
| [1] | World Health Organization (WHO). Available fromhttp://www. who.int. |
| [2] | Xiao X, Shao SH, Chou KC. A probability cellular automaton model for hepatitis b viral infections Biochem Biophys Res Commun 2006; 342: 605-15. |
| [3] | Triampo W, Baowan D, Tang I, Nuttavut N, Wong-Ekkabut J, Dougchawee G. A simple deterministic model for the spread of leptospirosisin Thailand Int J of Biomed 2007; 2: 22-6. |
| [4] | Sloot P, Chen F, Boucher C. Cellular automata model of drug therapy for HIV infection Cellular Automata for Research and Industry (ACRI) 2002; LNCS 2493: 282-93. |
| [5] | Ormerod C. Cellular automata model of HIV infection on tilings of the plane In: Proceedings of the 7th Asia-Pacific Conference on Complex Systems; 2004. Available from: http://www.maths.usyd. edu.au/u/pubs/publist/preprints/2004/ormerod-38.html |
| [6] | Lichtenberger K. Stochastic cellular automata models in disease spreading and ecology Doctoral Thesis Graz. 2005. |
| [7] | Eliades DG, Symeonidis AL, Mitkas PA. Genecity A multi agent simulation environment for hereditary diseases Computer Systems and Applications 2006; 8: 529-36. |
| [8] | Coelho FC, Cruz OG, Codeco CT. Epigrass a tool to study disease spread in complex networks Nature precedings, Available fromhttp://epigrass.sourceforge.net 2007. |
| [9] | Castiglione F, Duca K, Jarrah A, Laubenbacher R, Hochberg D, Thorley-Lawson D. Simulating epstein-barr virus infection with c-immsim Bioinformatics 2007; 23(11): 1371-77. |
| [10] | Beauchemin C, Samuel J, Tuszynski J. A simple cellular automaton model for influenza a viral infections J Theor Biol 2005; 232(2): 223-34. |
| [11] | Aschwanden C. Spatial simulation model for infectious viral diseases with focus on SARS and the common flu In: Proceedings of the 37th Hawaii International Conference on Systems Sciences; Dec 2004; (HICSS'04) Track 6 Vol 6 |
| [12] | Hethcote HW. The mathematics of infectious diseases Society for Industrie and Applied Mathematics (SIAM review) 2000; 42: 599-653. |
| [13] | Getz W, Lloyd-Smith J, Cross P, et al. Modeling the invasion and spread of contagious diseases in heterogenous populations Disease evolution Models concepts and data analyses In: Feng Z, Dieckmann U, Levin SA, Eds. Discrete Mathematics and Theoretical Computer Science AMS/DIMACS 2005; 71: 113-44. |
| [14] | Getz W, Lloyd-Smith J. Basic methods for modeling the invasion and spread of contagious diseases Disease evolution Models concepts and data analyses In: Feng Z, Dieckmann U, Levin SA, Eds. Discrete Mathematics and Theoretical Computer Science AMS/DIMACS 2007; 71: 87-109. |
| [15] | Deutsch A, Dorman S. Cellular Automaton Modeling of Biological Pattern Formation In: ISBN 0-8176-4281-1 Birkhäuser. 2005. |
| [16] | SUN developer network (SDN) Available from: http://java.sun. com |
| [17] | Tyrolean Government Available from: http://www.tirol.gv.at/. |
| [18] | IMDb - the internet movie database Available from:http://imdb.com/title/tt0107048/ Groundhog Day |
| [19] | Second Life Available from:http://secondlife.com/ |