- Home
- About Journals
-
Information for Authors/ReviewersEditorial Policies
Publication Fee
Publication Cycle - Process Flowchart
Online Manuscript Submission and Tracking System
Publishing Ethics and Rectitude
Authorship
Author Benefits
Reviewer Guidelines
Guest Editor Guidelines
Peer Review Workflow
Quick Track Option
Copyediting Services
Bentham Open Membership
Bentham Open Advisory Board
Archiving Policies
Fabricating and Stating False Information
Post Publication Discussions and Corrections
Editorial Management
Advertise With Us
Funding Agencies
Rate List
Kudos
General FAQs
Special Fee Waivers and Discounts
- Contact
- Help
- About Us
- Search


The Open Anatomy Journal
(Discontinued)
ISSN: 1877-6094 ― Volume 6, 2014
Magnetic Resonance Imaging of the Normal Stifle Joint in Buffaloes (Bosbubalis): An Anatomic Study
M.S. Sherif, M. Attia, H. Bahgaat, A. Kassab*
Abstract
This research has been conducted in order to describe the normal anatomical structures of the stifle joint in buffaloes (Bos bubalis) by using the magnetic resonance imaging and the corresponding anatomical sections. The anatomical slices were used to facilitate the interpretation of the MRI images, and therefore the diagnosis for stifle related diseases would be much easier. The hind limbs of ten healthy adult buffaloes (Twenty stifle joints) were used. After slaughtering, MR images were made in sagittal, transverse, and dorsal planes. After that, the limbs were sectioned by using an electric band saw according to the corresponding MRI images after freezing at -20° for 48 hours. Clinically relevant anatomic structures were identified and labeled at each level of the matching images (MR and anatomic slices).
MRI images were used to recognize the bony and soft tissue structures of the stifle joint. The articular cartilage appeared as line of hyperintensity which was separated from the subcondral bone by gray line (moderate signal intensity). It was difficult to differentiate between the synovia, infrapatellar fat body and the articular cartilage because of the similar hyperintensity. The meniscial, femoropatellar and cruciate ligaments were recognized as moderate signal intensity. The collateral ligaments and intermediate patellar ligaments, and the common tendon of the Mm. extensor digitorum longus and peroneus tertius, as well as, the menisci and the medial patellar fibrocartilage appeared as hypointense signal.
The knowledge of normal anatomy of the stifle joint would serve as initial reference and guide for the stifle diagnosis of the suspected buffaloes by using MRI technique.
Article Information
Identifiers and Pagination:
Year: 2014Volume: 6
First Page: 27
Last Page: 35
Publisher Id: TOANATJ-6-27
DOI: 10.2174/1877609401406010027
Article History:
Received Date: 23/12/2013Revision Received Date: 26/2/2014
Acceptance Date: 5/3/2014
Electronic publication date: 7/3/2014
Collection year: 2014
open-access license: This is an open access article licensed under the terms of the Creative Commons Attribution Non-Commercial License (http://creativecommons.org/licenses/by-nc/3.0/) which permits unrestricted, non-commercial use, distribution and reproduction in any medium, provided the work is properly cited.
* Address correspondence to this author at the Department of Anatomy and Embryology, Faculty of Veterinary Medicine, Benha University, Egypt; Tel: 0020132461411; Fax: 0020132460640; E-mail: kassab_aa@yahoo.com
| Open Peer Review Details | |||
|---|---|---|---|
| Manuscript submitted on 23-12-2013 |
Original Manuscript | Magnetic Resonance Imaging of the Normal Stifle Joint in Buffaloes (Bosbubalis): An Anatomic Study | |
INTRODUCTION
Magnetic resonance Imaging (MRI) is widely used in the diagnosis of human musculoskeletal disease [1]. This may be due to the superior resolution of the MRI for the soft tissue structures and significant ability to take images in multiple planes.
Diseases of the stifle joint in the ruminants are common, especially in the buffalo. The stifle joint is usually exposed to many surgical problems as patellar luxation, gonitis (stifle arthritis), synovitis, fracture, meniscial tearing and cruciate ligament sprain in the bovine [2].
Many researches have been conducted in the bovine lameness because of its economic importance and for better understanding of the pathogenesis of the bovine stifle problems [3].
The bovine stifle has a complex structure in joints, ligaments and tendons [4]. Classical anatomic atlases don’t provide the spectrum of views and the required details for the modern diagnostic and surgical techniques [5].
Magnetic resonance imaging (MRI) would give more additional information on soft tissue and osseous injuries for the bovine digits and hoof if it was compared by the current diagnostic imaging technique such as radiography and ultrasonography which provides limited information [6, 7]. Furthermore, Tendons and ligaments are more distinguishable by MRI than computed tomography or ultrasonography [8, 9].
To date, the detailed comparative study of normal gross and MRI sections of the buffalo stifle has not been conducted yet. Therefore, this study will describe the normal anatomy of the stifle joint in buffaloes (Bos bubalis) for the magnetic resonance images and its correlated anatomical sections to facilitate the interpretation during the diagnosis.
MATERIALS AND METHODS
Animals- Twenty stifle joints of ten healthy buffaloes, 7 males and 3 females were used in this study. Their ages ranged from 10 - 17 months. The selected animals were subjected to clinical, radiographic and ultrasonographic examinations before slaughtering; no abnormalities were observed. Three animals were collected from the teaching farm at the Faculty of Veterinary Medicine and the Faculty of Agriculture at Benha University in Egypt, while other seven animals were obtained from Benha slaughterhouse. Immediately after slaughtering, limbs were cooled and imaged within 12 hours to minimize post-mortem changes.
MRI examination- SIGNA HDe 1.5 TGE MRI scanner was used to accomplish the Magnetic Resonance Imaging; by placing in a torso phased array coil (2 Tesla) for the sagittal and dorsal scans and in a body coil (2 Tesla) for the transverse scans, 5 mm slicing as indicated by Van der Straaten et al. [10]. Scanning details (as TR, TE and others) found in the MR images. Then, the MR images were reformatted with a software E-film.
After the MR images were obtained, the limbs articular capsule were distended by either red or blue colored gum milk latex according to Nickel et al. [11] and Dyce et al. [12] in ruminants. Immediately after injection, the joints were flexed and extended 100 times and frozen at -20°. The limbs then were sectioned using an electric band saw, like the corresponding MR images. All sections were cleaned, photographed and kept for the future studies.
Comparison of MR and anatomic images-Important anatomic structures were identified and labeled in the matched MR images and gross-sections of the buffalo stifle joint with the aid of multiple references [11, 13-15]. Ten photos from both MRI and gross sections were selected for publication. Some structures present in the anatomical sections could not be seen on the corresponding MR images and vice versa.
RESULTS
From the collection of matched MR and anatomical images, 3 representative sagittal combinations were selected (Figs. 1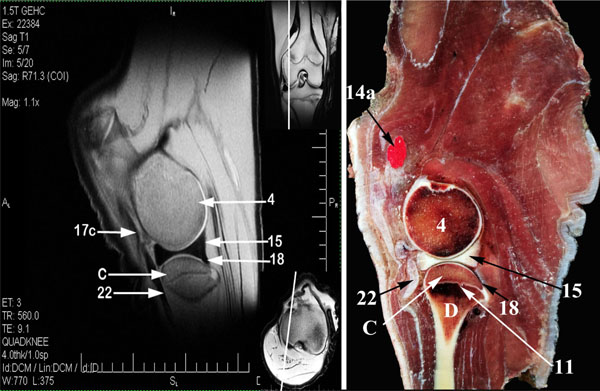 -3
-3 ), 4 cross sections (Figs. 4
 -7
-7 ), and 3 dorsal combinations (Figs. 8
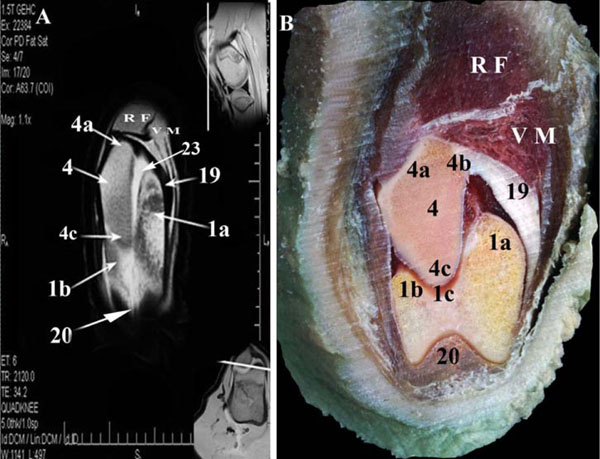 -10
-10 ). On each MR image, a further two small photos were put in corners to clarify the main section level. On the anatomic slices, it was possible to identify all muscles, tendons, and ligaments surrounding the stifle joint.


The bone surfaces could be easily identified in all MR images. The compact bone appeared as hypointense signal, while spongy bone showed heterogenous signal intensity due to high fat content in the bone marrow and trabecular pattern. There was a regular and obviously distinct corticocancellous junction. The distal epiphysis of the femur and proximal diaphysis of the tibia ossification centers appeared as irregular line of homogenous hypointense signal. The articular cartilage appeared as line of hyperintensity which was separated from the subcondral bone by gray line (moderate signal intensity). The signal intensity of the articular cartilage was to some extent similar to synovia.
The intermediate, medial and lateral patellar ligaments were recognized as hypointense signal structures converging distally. The medial and lateral femoropatellar ligaments, and the cranial and caudal meniscotibial ligaments, as well as, the meniscofemoral ligament of the lateral meniscus appeared as moderate signal intensity structures (Figs. 1, 3, 10). The cranial and caudal cruciate ligaments were recognized as moderate signal intensity bands (Fig. 7). The cranial cruciate ligament consisted of two strata; craniomedial and caudolateral. Both strata extended proximally from the medial wall of the lateral femoral condyle. The craniomedial stratum inserted in the lateral wall of the medial intercondyloid tubercle in the central intercondyloid fossa, while the caudolateral stratum ended in the central intercondyloid fossa (Fig. 6 ). The Caudal cruciate ligament passed medially to the cranial cruciate ligament. It extended proximally from the femoral intercondylar fossa and inserted in the popliteal notch (Fig. 7). The medial patellar fibrocartilage (Figs. 2
 , 3) appeared as hypointense signal structure and acted as origin for the medial patellar ligament and as insertion of the medial femoropatellar ligament.
The common tendon of Mm. extensor digitorum longus and peroneus tertius (Fig. 9 ) were recognized as hypointense signal structures. The infrapatellar fat body interposed between the synovial and fibrous layers of the articular capsule and occupied the space which was formed by the patella proximally, the tibial condyles distally, the femoral condyle caudally and the patellar ligaments cranially. The infrapatellar fat body separated the patellar ligament from the meniscus caudally and appeared as hyperintense signal structure so it was difficult to differentiate from the synovia because both had the same intensity (Fig. 3).
The Menisci showed very homogenous hypointensity signal in MRI and present between the femoral and tibial condyles articular cartilages to divide the medial and lateral Femorotibial joint cavities partially into two compartments for each; The Proximal sac formed between the proximal surface of the meniscus and the femoral condyle articular cartilage, while the distal sac formed between the distal surface of the meniscus and the tibial condyle articular cartilage (Figs. 1, 10). Both proximal and distal Lateral femorotibial compartments (Fig. 10) connected medially at the area between the lateral femoral and tibial condyles. The proximal and distal medial femorotibial compartments (Fig. 3) connected at the axial notched border of the medial meniscus. The proximal compartment of the medial femorotibial sac connected freely with the femoropatellar sac at the level of the ridge which was located between the medial trochlear ridge and medial femoral condyle, but at the same time, the medial and lateral femorotibial sac was separated at the level of the cruciate ligament decussating above the central tibial intercondylar fossa. The lateral meniscus didn’t cover the caudolateral part of the lateral tibial condyle because that part was occupied by the tendon of origin of the M. popliteus to separate the lateral meniscus from the lateral collateral ligament. The lateral meniscus was separated from the tendon of origin of the M. popliteus by lateral Femorotibial synovial pouch that act as a bursa (Fig. 10). The tendon of origin of the M. popliteus appeared as a hypointense signal structure.
The proximal and distal femorotibial sacs appeared as a thin line of hyperintensity, proximal and distal to the lateral meniscus respectively (Figs. 1, 6, 10). The femoropatellar synovial sac appeared as hyperintense signal, as well (Fig. 3). The femoropatellar sac had a pouch which extended proximally for about 6 cm to form suprapatellar pouch. That pouch was separated from the overlying two portions of the M. vastus intermedius by fatty tissue.
DISCUSSION
The present study serves as primary reference that aid in MR imaging diagnosis of the buffalo stifle disorders. The knowledge of the normal cross sectional anatomy of the stifle joint in buffalo is essential for the evaluation of MRI scans. MR images in the current study provide adequate anatomical details which were compared thoroughly with the corresponding gross anatomical sections.
Radiography has a limited capability to evaluate the soft tissue structures. Although ultrasonography provides visualization of the tendons and ligaments, it provides a limited field of imaging and each structure need to be imaged separately [16]. On the other hand, the soft tissue is difficult to be evaluated by ultrasonography as it is not possible to perform a cross sectional examination through the entire digit [17].
MRI scan is excellent imaging modality, however, its usage in veterinary medicine is limited as it is expensive and the animal should be anaesthetized [18]. Nevertheless, it has some potential advantages over the routine radiography; it provides a cross-sectional image with superior soft tissue differentiation and no superimposition of the overlying structures, which can be used for better diagnosis of abnormalities [19]. It seems that MRI scans could be beneficial if it used in large scale farms for routinely diagnosis and making-decision for surgical interventions.
The signal intensities in the cadaver specimens can be different in live animals because of the loss of fluid and blood in the cadavers, the freezing and absence of blood flow, however, the gross anatomy is the same in horses [10, 20]. There is uncertainty that it would be the same case in buffalo due to the lack of MRI scans for veterinary purpose in Egypt, therefore this research based only in specimens from the freshly slaughtered animals.
The results reveal that the compact bone appears as hypointense signal, while the spongy bone as moderate intensity structure. Such findings come in agreement with Van der Straaten et al. [10] and Holocombe et al. [21] in horses.
The articular cartilage shows hyperintensity and separate from the bone by gray line (moderate signal intensity). These results agree with Soler et al. [22] in the dog and disagree with Van der Straaten et al. [10] and Holocombe et al. [21] in the horse who recognized the articular cartilage as a layer of homogenous moderate signal intensity.
The medial and lateral menisci showed hypointense signal which was the similar to what was previously reported [10, 21-23]. However, Murray et al. [24] in the horse reported that the medial and lateral menisci ranged from moderate to low signal intensity depending on Tesla used.
The intermediate, medial and lateral patellar ligaments appeared with hypointense signal that comes parallel with the earlier results [7, 10, 21, 22, 24].
The infrapatellar fat body appears as hyperintense signal so it was difficult to differentiate it with the synovial capsule because both appear with the same intensity which resemble to the past results [21, 24].
The medial and lateral femorotibial synovial sacs are separated at the level of the cruciate ligament decussation which agree with previous investigations [25-31] and disagree with Gad [32] in the goat who argued that both medial and lateral sacs are connected inferior to cruciate ligament decussation.
CONCLUSION AND CLINICAL RELEVANCE
The knowledge of normal anatomy of the buffalo stifle joint is necessary to provide an accurate interpretation of MR images. This study is a preliminary step toward the clinical use of MR in soft tissue injuries of the stifle in the buffalo, but more investigations may be required to evaluate the effectiveness of MRI in the diagnosis of the stifle joint diseases.
CONFLICT OF INTEREST
The authors confirm that this article content has no conflict of interest.
ACKNOWLEDGEMENTS
The authors appreciate the sincere help of Prof. Dr. Ahmed Faried, professor of human diagnostic imaging and Dr. Amr Raslan, Head of Tanta Scan diagnostic imaging laboratory, for their invaluable assistance in the practical part of this study.