- Home
- About Journals
-
Information for Authors/ReviewersEditorial Policies
Publication Fee
Publication Cycle - Process Flowchart
Online Manuscript Submission and Tracking System
Publishing Ethics and Rectitude
Authorship
Author Benefits
Reviewer Guidelines
Guest Editor Guidelines
Peer Review Workflow
Quick Track Option
Copyediting Services
Bentham Open Membership
Bentham Open Advisory Board
Archiving Policies
Fabricating and Stating False Information
Post Publication Discussions and Corrections
Editorial Management
Advertise With Us
Funding Agencies
Rate List
Kudos
General FAQs
Special Fee Waivers and Discounts
- Contact
- Help
- About Us
- Search


The Open Atmospheric Science Journal
(Discontinued)
ISSN: 1874-2823 ― Volume 14, 2020
Seasonal and Annual Trends in Australian Minimum/Maximum Daily Temperatures
W. A. van Wijngaarden*, A. Mouraviev
Abstract
Seasonal and annual trends in Australian minimum and maximum temperatures were studied. Records of daily minimum and maximum temperatures averaged over each month, extending as far back as 1856 were examined. Over 1/2 million monthly temperature values were retrieved from the Australian Bureau of Meteorology for 299 stations. Each station had an average of 89 years of observations. Significant step discontinuities affected the maximum temperature data in the 19th century when Stevenson screens were installed. The temperature trends were found after such spurious data were removed and averaged over all stations. The resulting trend in the minimum (maximum) daily temperature was 0.67 ± 0.19 (0.58 ± 0.26) oC per century for the period 1907-2014. Decadal fluctuations were evident in the maximum daily temperature with most of the increase occurring in the late 20th century. The minimum and maximum daily temperature trends were also found for the various seasons. The minimum daily temperature trend exceeded the maximum daily temperature trend for all seasons except during June to August. The largest increases in minimum temperature as well as the smallest maximum temperature increases were found for the region north of 30 oS latitude and east of 140 oE longitude. There was also evidence that urban stations had greater increases in maximum daily temperature than those located in a rural environment.
Article Information

Identifiers and Pagination:
Year: 2016Volume: 10
First Page: 39
Last Page: 55
Publisher Id: TOASCJ-10-39
DOI: 10.2174/1874282301610010039
Article History:
Received Date: 14/07/2016Revision Received Date: 29/08/2016
Acceptance Date: 02/09/2016
Electronic publication date: 30/09/2016
Collection year: 2016
open-access license: This is an open access article licensed under the terms of the Creative Commons Attribution-Non-Commercial 4.0 International Public License (CC BY-NC 4.0) (https://creativecommons.org/licenses/by-nc/4.0/legalcode), which permits unrestricted, non-commercial use, distribution and reproduction in any medium, provided the work is properly cited.
* Address correspondence to this author at the Centre for Physics Department, Petrie Building, York University, 4700 Keele St., Toronto, ON Canada; Tel/Fax: 416-736-2100 x77750; E-mail: wlaser@yorku.ca
| Open Peer Review Details | |||
|---|---|---|---|
| Manuscript submitted on 14-07-2016 |
Original Manuscript | Seasonal and Annual Trends in Australian Minimum/Maximum Daily Temperatures | |
INTRODUCTION
Archival records of temperature provide invaluable information for studying climate change [1Stocker TF, Qin D, Plattner GK, et al. Climate Change 2013: The Physical Science Basis, Contribution of Working Group I to the 5th Assessment Report of the Intergovernmental Panel on Climate Change. In: Cambridge, UK and New York, NY, USA: Cambridge University Press 2013.]. Stations with the longest data records are predominantly located in the Northern Hemisphere, especially in Western Europe and the United States [2National Centers for Environmental Information. Available at: www.ncdc.noaa.gov [Accessed on: 15 June 2016]]. For the Southern Hemisphere, Australia has records extending as far back as 1856 [3Australian Government, Climate Data Online. Available at: www.bom.gov.au/climate/data [Accessed on: 15 June 2016]]. Its meteorological instruments and procedures are likely to be more uniform than in the case of Europe or South America which have many national jurisdictions. This is important as changes in apparatus or observation methodology can cause inhomogeneities that if not taken properly into account can significantly perturb temperature trends [4van Wijngaarden WA, Vincent LA. Examination of trends in hourly surface relative humidity in canada during 1953-2003. J Geophys Res 2005; 110: D22102.
[http://dx.doi.org/10.1029/2005JD005925] -9Verbesselt J, Zeileis A, Herold M. Near real-time disturbance detection using satellite image time series. Remote Sens Environ 2013; 123: 98-108.
[http://dx.doi.org/10.1016/j.rse.2012.02.022] ].
A second reason to study Australia is to examine whether there is any difference between trends in minimum and maximum daily temperatures. Some studies have found the minimum daily temperature appears to be increasing more than the maximum daily temperature due to turbulent mixing of warmer air to the surface caused by changes in the intensity of the stable boundary layer, for example, due to urbanization and other local and regional land uses [10Klotzbach PJ, Pielke RA Sr, Pielke RA Jr, Christy JR, McNider RT. An alternative explanation for differential temperature trends at the surface and in the lower troposphere. J Geophys Res 2009; 114: D21102.
[http://dx.doi.org/10.1029/2009JD011841] -13Salamanca F, Georgescu M, Mahalov A, Moustaoui M. Summertime response of temperature and cooling energy demand to urban expansion in a semiarid environment. J Appl Meteorol Climatol 2015; 54: 1756-72.
[http://dx.doi.org/10.1175/JAMC-D-14-0313.1] ]. It has also been suggested that changing cloud cover may be partially responsible for decreasing the daily temperature range [14Karl TR, Jones PD, Knight RW, et al. A new perspective on recent global warming: Asymmetric trends of daily maximum and minimum temperature. Bull Am Meteor 1993; 74: 1007: 1023.]. One study did find evidence of urban heat island features in southeast Australian towns [15Torok SJ, Morris CJ, Skinner C, Plummer N. Urban heat island features of southeast Australian towns. Aust Met Mag 2001; 50: 1-13.]. It is also interesting to see if the trends exhibit a seasonal dependence. Previous work has found that Arctic and North American temperatures have increased more during December to May than during June to November [6Isaac V, van Wijngaarden WA. Surface water vapor pressure and temperature trends in north america during 1948-2010. J Clim 2012; 25: 3599-609.
[http://dx.doi.org/10.1175/JCLI-D-11-00003.1] , 16van Wijngaarden WA. Arctic temperature trends from the early nineteenth century to the present. Theor Appl Climatol 2015; 122: 567-80.
[http://dx.doi.org/10.1007/s00704-014-1311-z] ].
A number of studies have analyzed Australian temperatures [17Torok SJ, Nicholls N. A historical annual temperature dataset for Australia. Aust Met Mag 1996; 45: 251-60.-19Trewin B. A daily homogenized temperature dataset for Australia, Int. J Clim 2013; 33: 1510-29.
[http://dx.doi.org/10.1002/joc.3530] ]. In particular, the Australian Bureau of Meteorology (BOM) provides the monthly averaged minimum and maximum daily temperatures, hereafter just referred to as the minimum and maximum temperatures, at a number of stations [3Australian Government, Climate Data Online. Available at: www.bom.gov.au/climate/data [Accessed on: 15 June 2016]]. This includes data that is a composite of observations made at different sites near a given location. The resulting time series at many stations have obvious inhomogeneities. Torok and Nicholls [17Torok SJ, Nicholls N. A historical annual temperature dataset for Australia. Aust Met Mag 1996; 45: 251-60.] examined data from 224 stations covering the period 1910-1994. Some of these time series were created by making a composite of data observed at nearby stations. Various statistical analyses were used to compare each time series to nearby stations to detect and correct discontinuities. The mean number of adjustments to minimum (maximum) temperature was 6.6 (6.1) per station. Minimum and maximum temperatures were found to have both increased since 1950, with minimum temperatures increasing more than the maximum temperatures.
Daily minimum and maximum temperatures have been studied for 38 stations in southeastern Australia for the period 1860-2009 [20Ashcroft L, Karoly DJ, Gergis J. Southeastern Australian climate variability 1860-2009: a multivariate analysis. Int J Clim 2014; 34: 1928-44.
[http://dx.doi.org/10.1002/joc.3812] ]. The data were examined for inhomogeneities and reference series were created using neighbouring station data. Over half of the nearly 200 adjustments made to each of the minimum and maximum temperature data during 1860-1950 were supported by changes recorded in the station histories. The minimum temperature appears to have steadily increased by about 1 oC during the last century and a half. The maximum temperature appears to have been about stable until 2000 when it increased abruptly by about 0.5 oC.
A homogenized daily minimum and maximum temperature dataset has been generated by the Australian Climate Observations Reference Network (ACORN) [19Trewin B. A daily homogenized temperature dataset for Australia, Int. J Clim 2013; 33: 1510-29.
[http://dx.doi.org/10.1002/joc.3530] , 21Trewin B. Techniques involved in developing the Australian Climate Observations Reference Network – Surface Air Temperature dataset, Center for Australian Weather and Climate Technical Report No 049. 2012. ISBN: 978 0 643 10815 8-23Australian Climate Observations Reference Network - Surface Air Temperature Dataset. Available at: https://data.gov.au/dataset/acorn-sat. [Accessed on: 15 June 2016]]. This network consists of 112 stations and covers the period from 1910 onwards. Sixty of the stations have data for every month in all years during 1910-2014. Inhomogeneities arising from changes in instruments and the station site location were detected using a combination of metadata and statistical methods. A so called percentile matching algorithm was developed to make adjustments to correct the data. The adjusted ACORN data of daily minimum and maximum temperatures is available from the Australian Bureau of Meteorology [3Australian Government, Climate Data Online. Available at: www.bom.gov.au/climate/data [Accessed on: 15 June 2016]]. Australian data has also been analyzed by NOAA’s National Climate Data Center as part of the Global Historical Climate Network (GHCN) analysis and both raw and adjusted monthly averaged minimum and maximum daily temperatures are available from the Royal Dutch Meteorological Institute and NOAA’s National Center for Environmental Information [2National Centers for Environmental Information. Available at: www.ncdc.noaa.gov [Accessed on: 15 June 2016], 24KNMI Climate Explorer. Available at: https://climexp.knmi.nl [Accessed on: 15 June 2016]]. The adjustments made to station data by ACORN and GHCN ranged from a few hundredths of a degree to nearly 2 oC and do not always agree with each other. A very small annual temperature adjustment may result from positive and negative adjustments made in different seasons. The inhomogeneities are not always apparent nor supported by station history metadata and concerns have been raised about their accuracy [25Quirk T. The australian temperature anomaly, 1910-2000. Energy Environ 2009; 20: 97-100.
[http://dx.doi.org/10.1260/095830509787689231] ]. The ACORN analysis unlike that of GHCN did have access to metadata. ACORN has made a valiant effort to record the history of each station [22Fawcett RJ, Trewin BC, Braganza K, et al. On the sensitivity of Australian temperature trends and variability to analysis methods and observation networks, Center for Australian Weather and Climate Research Technical Report No 050. 2012. ISBN: 978 0 643 10819 6, 23Australian Climate Observations Reference Network - Surface Air Temperature Dataset. Available at: https://data.gov.au/dataset/acorn-sat. [Accessed on: 15 June 2016]]. Unfortunately, the available documentation does not adequately describe all pertinent changes to the measurement site and/or relocation of meteorological instruments. The station data have also been used to develop gridded datasets with a resolution of 0.05o x 0.05o [18Jones DA, Wang W, Fawcett R. High-quality spatial climate datasets or Australia. Aust Met Ocean J 2009; 58: 233-48.].
This study examined the minimum and maximum temperatures observed at 299 stations. Each time series was first checked for inhomogeneities. Spurious data were removed rather than attempting to make corrective adjustments. The change in temperature relative to the 20th century was computed and averaged over all stations. The minimum and maximum temperature trends were then found. The results agreed closely with the ACORN and GHCN analyses that independently adjusted data for inhomogeneities, but the present work considered a longer time interval of 1880-2015 and considerably more stations. The trends did exhibit decadal variations. Seasonal trends were also found. The trend dependences on latitude and longitude as well as whether the station was located in either a rural or urban environment were also examined.
DATA ANALYSIS
Monthly averaged daily minimum and maximum values were downloaded from the Australian Bureau of Meteorology [3Australian Government, Climate Data Online. Available at: www.bom.gov.au/climate/data [Accessed on: 15 June 2016]]. Stations were considered that had at least 50 years of data or were in close proximity to an ACORN station or a part of the ACORN network. The annual and seasonal averages were only computed if all monthly values in a year or season were present. The 299 stations listed in the Appendix A had an average of 89 years of observations. Fig. (1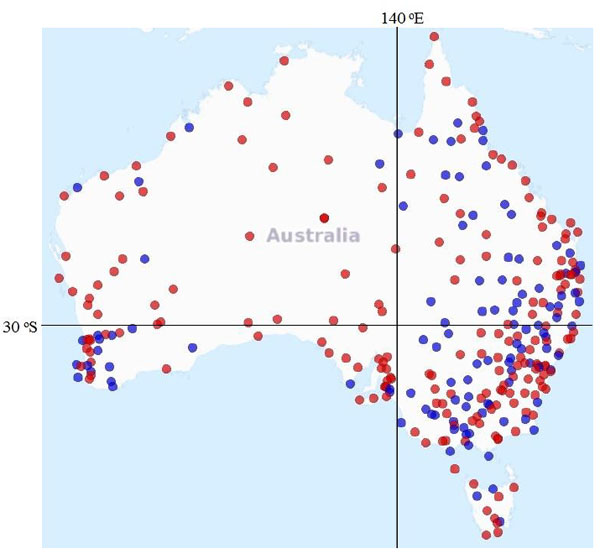 ) shows the station locations. The longest records of observations were found for Melbourne and Sydney where data extend back to the 1850s. A significant increase in the number of operating stations occurred in 1907. A number of stations closed in recent decades. Annual averaged minimum and maximum temperatures could be found for 88% of the years that stations were operational. Stations having daily data for the ACORN network as well as monthly adjusted data from the GHCN archive are listed in the Appendix B.
The temperature relative to the 20th century was computed. This extended reference period, as opposed to the period 1961-1990, was chosen since a number of stations closed before 1961. The different reference periods changed the trends by considerably less than the trend uncertainty. It was evident that a number of stations had spurious data as is
 |
Fig. (1) Stations examined in this study. A red (blue) circle denotes a station where data was taken for less (more) than 100 years. |
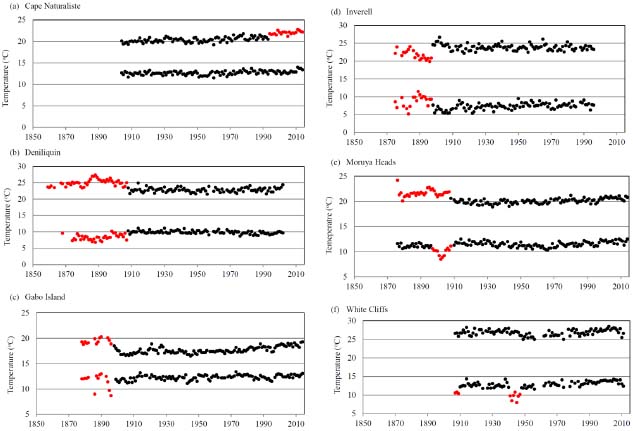 |
Fig. (2) The average minimum and maximum annual temperature data are plotted for various stations. The red points are suspect as is discussed in the text. |
illustrated in Fig. (2 ). Some data values were very distant from the average minimum or maximum temperatures. This occurred most often when a station began operation in the late 1800s as is shown for Deniliquin, Gabo Island and Inverell. The same stations also had missing observations for a number of years during their first two decades of operation. Step discontinuities were also evident in some time series. These frequently preceded a gap in the data which may indicate that either two different time series were appended or a change in instruments had occurred. Most of these steps occurred in the late 1800s as shown by the data for Deniliquin, Moruya Heads and White Cliffs. However, the data for a few stations show a sudden upward jump during the 20th century such as occurred in the maximum temperature for Cape Naturaliste in 1994. These temperature discontinuities were not exhibited at nearby stations indicating that they are not the result of a climate fluctuation.
This study adopted two criteria for determining whether a data point was spurious and required removal. The first criterion was to keep the first two decades of data only if data were present for at least two thirds of those years. Many time series of stations starting operation in the late 19th century exhibited missing data that cast doubt on the reliability of the observations. The second criterion was to detect step discontinuities [5Vincent LA, van Wijngaarden WA, Hopkinson R. Surface temperature and humidity trends in Canada for 1953-2005. J Clim 2007; 20: 5100-13.
[http://dx.doi.org/10.1175/JCLI4293.1] , 7Verbesselt J, Hyndman R, Newnham G, Culvenor D. Detecting trend and seasonal changes in satellite image time series. Remote Sens Environ 2010; 114: 106-15.
[http://dx.doi.org/10.1016/j.rse.2009.08.014] -9Verbesselt J, Zeileis A, Herold M. Near real-time disturbance detection using satellite image time series. Remote Sens Environ 2013; 123: 98-108.
[http://dx.doi.org/10.1016/j.rse.2012.02.022] ]. The data in each time series was examined as follows. For a minimum or maximum temperature occurring at year td, the average and standard deviation were found immediately before and after, over intervals [td - Ns + 1, td] and [td + 1, td + Ns]. The means (standard deviations) evaluated in the intervals extending over Ns years before and after year td were denoted by µL and µR (σL and σR), respectively. The shorter of the time series occurring either before or after year td was removed if |µL - µR|> σL + σR. A station time series was discarded entirely if a second discontinuity was detected.
Application of these criteria is shown in Fig. (3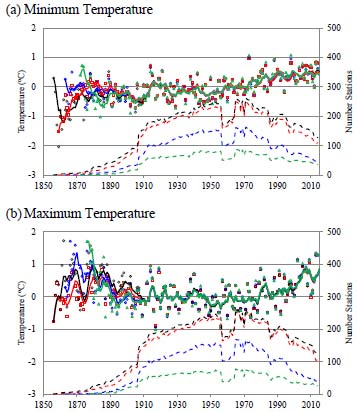 ). It shows plots of the minimum and maximum daily temperature relative to the 20th century averaged over all stations for the raw data as well as when data having discontinuities were removed. The procedure to detect discontinuities was considered for the cases of Ns = 5, 6, 7, 8, 9, 10 years. Fig. (3) shows the amount of data discarded increased as Ns decreased from 10 to 5, as well as the result of discarding station time series in their entirety if a single discontinuity was found. However, the differences between the 5 year running

average change in temperature for raw data and the cases of Ns = 10 - 5 were negligible for the minimum temperature data after 1880 and maximum temperatures following 1907. The differences between the curves shown in Fig. (3) are largest for the data in the 19th century when there are relatively few stations.
RESULTS
Table 1 shows the trends for the minimum and maximum daily temperatures for the intervals 1880-2014 and 1907-2014. The uncertainty of each trend in this study was defined by the 95% confidence interval found using the statistical t-test. The possibility of correlation effects was examined by binning the data over multi-year intervals. This had negligible effect on the trends. The 1907-2014 trends for both minimum and maximum temperature change vary little depending on the value of Ns used to determine the presence of a discontinuity. The maximum temperature trend for 1880-2014 evaluated using raw data is much smaller than the trends obtained after inhomogeneous data were discarded using Ns = 5 - 10. Table 1 also lists the trends found when time series were entirely removed if a single discontinuity was found. The time series shown in Fig. (3) were relatively insensitive to inhomogeneities that affect different stations at random times. Only systemic changes such as for example, the installation of Stevenson screens at all stations around 1900 will affect the averaged time series. This can be expected to have affected measurements of maximum temperatures more than minimum temperatures as the Stevenson screen prevents the exposure of the thermometer to direct sunlight.
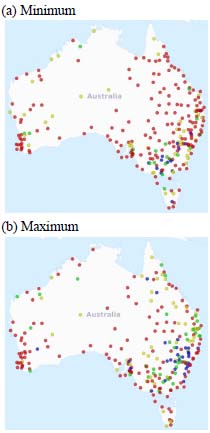
Fig. (3) shows the minimum temperature increased steadily throughout the 20th century while the maximum temperature remained approximately constant until suddenly increasing by approximately 0.5 oC around 2000. Considering the period 1907-2000, the minimum (maximum) temperature trend was 0.64 ± 0.24 (0.18 ± 0.29) oC per century. It should be noted that a number of Australian stations either ceased to operate or data was otherwise unavailable after 2000 as is the case worldwide [11McNider RT, Christy JR, Biazar A. A Stable Boundary Layer Perspective on Global Temperature Trends. Earth Environ Sci 2010; 13: 012003.]. Considering only stations operating after 2000, the minimum (maximum) temperature trend for 1907-2014 was 0.82 ± 0.19 (0.62 ± 0.26) oC per century. These values are compatible with those listed in Table 1.
Table 2 shows the seasonal trends for the minimum and maximum temperatures for the interval 1907-2014. These trends were found after inhomogeneous data was removed using the procedure discussed previously with Ns = 5. The minimum and maximum temperatures increased in all seasons. The minimum temperature trend is smallest during June to August while the maximum temperature increased the least during December to February. The minimum temperature trend exceeded the maximum temperature trend for all seasons except during June to August.
Figs. (4 -6
-6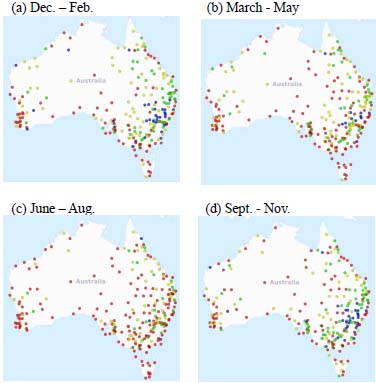 ) show the trends for stations having at least 50% of data for all years during 1907-2015. The trend significance was found using a t-test at the 5% level. It appears that especially in southeastern Australia that the maximum temperatures are increasing more for stations near the coast but some cooling is evident at inland stations. The reason for this is not clear although a number of these coastal stations are in an urban environment. Table 3 shows 70% (55%) of all stations exhibited statistically significant increasing annual minimum (maximum) temperature trends. Only 6% (12%) of stations exhibited statistically significant decreasing annual minimum (maximum) temperature trends. Less than 14% of stations exhibited statistically significant decreasing minimum or maximum temperature trends in any season. The percentage of stations experiencing increasing/decreasing temperature trends did not drastically change if stations having at least 75% of data for all years during 1907-2015 were considered; only the total number of stations decreases by about half. For example, the percentage of stations exhibiting statistically significant increasing annual minimum (maximum) temperature trends was 80% (54%) whereas 7% (14%) of stations exhibited statistically significant decreasing annual minimum (maximum) temperature trends.
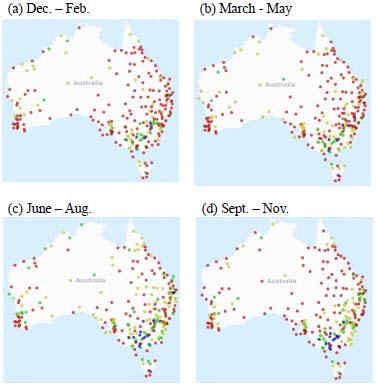


The latitudinal and longitudinal trend dependence is shown in Table 4. The minimum temperature trend increased much more than the maximum temperature trend for the region north of 30 oS latitude and east of 140 oE longitude. The difference between minimum and maximum temperature trends was not significant for other parts of Australia. Table 5 also shows evidence that urban stations experienced a somewhat greater increase in maximum temperature than those located in a rural environment defined as a region having a population under 10,000. The change in minimum temperature was comparable for both urban and rural stations. This larger increase in maximum temperature in urban areas is believed to be caused by the replacement of the natural ground cover by black asphalt, concrete etc. [26Oke TR. The energetic basis of the urban heat island. Q J R Meteorol Soc 1982; 108: 1-24.]. Removal of trees and vegetation eliminates cooling shade and reduces evapotranspiration [27Santos F. Trees – Natural Air Conditioners. Scientific Scribbles University of Melbourne [Accessed on: 24 August 2016]; Available at: https://blogs.unimelb.edu.au/sciencecommunication/2013/08/23/].
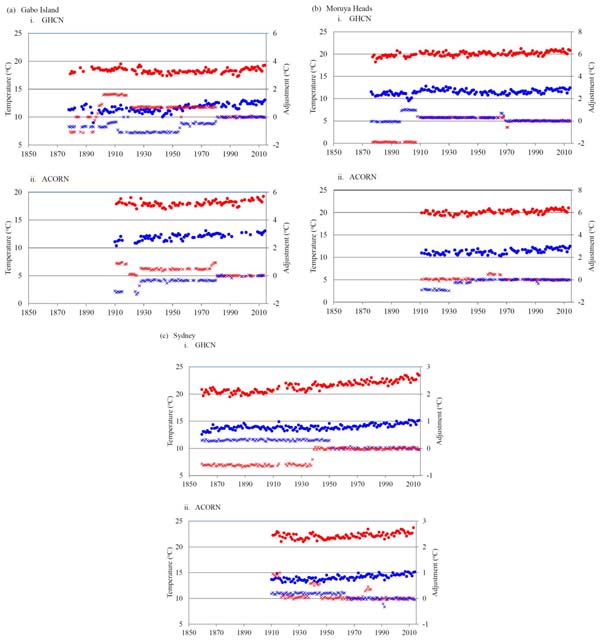
The results were compared to the homogenized ACORN and GHCN data. The average temperature value was computed for each month using the homogenized ACORN data if not more than 3 daily values were missing. These monthly minimum and maximum temperature values were then treated as described in the previous section. An average of 67 (70) years of minimum (maximum) temperature data were available for the 112 ACORN stations. Fig. (7 ) shows the ACORN and GHCN homogenized data and adjustments for three stations. The temperature adjustments were found using the unadjusted monthly average temperatures [2National Centers for Environmental Information. Available at: www.ncdc.noaa.gov [Accessed on: 15 June 2016], 3Australian Government, Climate Data Online. Available at: www.bom.gov.au/climate/data [Accessed on: 15 June 2016], 24KNMI Climate Explorer. Available at: https://climexp.knmi.nl [Accessed on: 15 June 2016]]. The adjustment corrections are as small as a few hundredths of a degree Centigrade which is considerably less than the measurement accuracy. Corrections as large as nearly 2 oC, affect the monthly mean data at some stations in the late 19th and early 20th centuries. This can greatly alter the resulting trend. For the case of Sydney, which has the second longest record of data available, the maximum temperature trend found using the raw data is 1.1 ± 0.2 oC per century while the GHCN adjusted data yields a trend of 1.8 ± 0.2 oC per century. The ACORN and GHCN adjustments sometimes disagree. For Sydney, the ACORN adjustment is +1 oC for the years 1910-1914 while the GHCN adjustment is -0.6 oC. Moreover, some homogenized time series still exhibit suspicious points such as the dip in the minimum temperature at Moruya Heads in the 1890s.
Fig. (8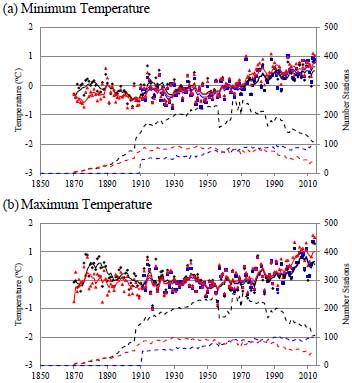 ) plots the minimum and maximum temperatures relative to the 20th century for the time series found by averaging the adjusted ACORN and GHCN data over available stations given in Appendices A and B with that obtained using the procedure for discarding inhomogeneous data discussed in this paper. The data is only plotted in Fig. (8) if at least 5 stations report data in a given year. The 5 year averaged curves of the ACORN analysis and this work nearly overlap in all years. There are some differences with the GHCN analysis. The GHCN minimum and maximum temperatures are somewhat lower than this work during the 1870s and 1880s when there were comparatively few stations. The GHCN maximum temperatures are higher than both the ACORN analysis and this work after 2000. These differences are not surprising given that the three analyses used different station datasets. Indeed, the same results are obtained for the period after 2000 if one only considers the subset of stations common to all three datasets. Closely overlapping minimum and maximum temperatures were obtained during the 20th century when the three datasets were comprised of the largest number of stations. The three independent analyses show similar decadal fluctuations in the minimum/maximum temperatures. Most notably, all indicate an increase in maximum temperature of about 0.5 oC occurred around 2000. This agrees with a previous study that examined data obtained for stations located in southeastern Australia [20Ashcroft L, Karoly DJ, Gergis J. Southeastern Australian climate variability 1860-2009: a multivariate analysis. Int J Clim 2014; 34: 1928-44.
[http://dx.doi.org/10.1002/joc.3812] ].
CONCLUSION
There are significant downward step discontinuities affecting Australian temperature data in the 19th century. This is not altogether surprising given that Stevenson screens were not universally installed until around 1900. These would have the effect of reducing the observed maximum temperature. The maximum temperature trend for Australia therefore is significantly different if raw or adjusted data is used. In contrast, the minimum temperature trends found using the raw and adjusted data are comparable.
This study found trends after inhomogeneous data were removed. The resulting time series found by averaging the temperatures relative to the 20th century for 299 stations agreed closely with the ACORN and GHCN analysis. In contrast to the present work, the ACORN and GHCN datasets each made multiple adjustments to the minimum and maximum temperatures observed at each station, and their adjustments frequently disagreed. For the ACORN dataset comprised of 112 stations, over 1,000 adjustments were made to the minimum and maximum temperatures. Many adjustments did not correspond with evident inhomogeneities in the original time series nor did they coincide with changes recorded in the station metadata history. Climate studies frequently wish to determine the temperature change occurring over a large geographical region. This work shows that averaging the temperature anomalies over many stations after large inhomogeneities have been discarded, gives a reliable estimate of the temperature trends. The reason is that small random temperature adjustments, which may be difficult if not impossible to accurately estimate at a given station, do not dramatically affect the average temperature trend.
Minimum daily temperatures over Australia have increased steadily throughout the 20th century. Maximum temperatures remained nearly constant until abruptly increasing around 2000. Similar temporal temperature changes have also been noted elsewhere such as in Europe and the Arctic (van Wijngaarden, 2014). For the period 1907-2014, the Australian minimum (maximum) temperature trend is 0.67 ± 0.19 (0.58 ± 0.26) oC per century. The mean temperature trend was found by plotting the average of the maximum and minimum temperatures for each year during 1907-2014. This yielded a mean temperature trend of 0.63 ± 0.19 oC per century. The minimum temperature increased least during June to August while the maximum temperature increase was smallest during December to February. Northeastern Australia experienced the largest minimum and the smallest increasing maximum temperature trend. Urban stations exhibited maximum temperature trends that were about 30% larger than those experienced in rural areas. Hence, the actual Australian mean temperature change during 1907-2014 may be a bit lower if this urban heat island effect is considered. Nevertheless, this estimate is comparable to the global average temperature change observed during the 20th century [1Stocker TF, Qin D, Plattner GK, et al. Climate Change 2013: The Physical Science Basis, Contribution of Working Group I to the 5th Assessment Report of the Intergovernmental Panel on Climate Change. In: Cambridge, UK and New York, NY, USA: Cambridge University Press 2013.].

CONFLICT OF INTEREST
The authors confirm that this article content has no conflict of interest.
ACKNOWLEDGEMENTS
The financial assistance of the Canadian Natural Science and Engineering Research Council is gratefully acknowledged.
REFERENCES
| [1] | Stocker TF, Qin D, Plattner GK, et al. Climate Change 2013: The Physical Science Basis, Contribution of Working Group I to the 5th Assessment Report of the Intergovernmental Panel on Climate Change. In: Cambridge, UK and New York, NY, USA: Cambridge University Press 2013. |
| [2] | National Centers for Environmental Information. Available at: www.ncdc.noaa.gov [Accessed on: 15 June 2016] |
| [3] | Australian Government, Climate Data Online. Available at: www.bom.gov.au/climate/data [Accessed on: 15 June 2016] |
| [4] | van Wijngaarden WA, Vincent LA. Examination of trends in hourly surface relative humidity in canada during 1953-2003. J Geophys Res 2005; 110: D22102. [http://dx.doi.org/10.1029/2005JD005925] |
| [5] | Vincent LA, van Wijngaarden WA, Hopkinson R. Surface temperature and humidity trends in Canada for 1953-2005. J Clim 2007; 20: 5100-13. [http://dx.doi.org/10.1175/JCLI4293.1] |
| [6] | Isaac V, van Wijngaarden WA. Surface water vapor pressure and temperature trends in north america during 1948-2010. J Clim 2012; 25: 3599-609. [http://dx.doi.org/10.1175/JCLI-D-11-00003.1] |
| [7] | Verbesselt J, Hyndman R, Newnham G, Culvenor D. Detecting trend and seasonal changes in satellite image time series. Remote Sens Environ 2010; 114: 106-15. [http://dx.doi.org/10.1016/j.rse.2009.08.014] |
| [8] | Verbesselt J, Hyndman R, Zeileis A, Culvenor D. Phenological change detection while accounting for abrupt and gradual trends in satellite image time series. Remote Sens Environ 2010; 114: 2970-80. [http://dx.doi.org/10.1016/j.rse.2010.08.003] |
| [9] | Verbesselt J, Zeileis A, Herold M. Near real-time disturbance detection using satellite image time series. Remote Sens Environ 2013; 123: 98-108. [http://dx.doi.org/10.1016/j.rse.2012.02.022] |
| [10] | Klotzbach PJ, Pielke RA Sr, Pielke RA Jr, Christy JR, McNider RT. An alternative explanation for differential temperature trends at the surface and in the lower troposphere. J Geophys Res 2009; 114: D21102. [http://dx.doi.org/10.1029/2009JD011841] |
| [11] | McNider RT, Christy JR, Biazar A. A Stable Boundary Layer Perspective on Global Temperature Trends. Earth Environ Sci 2010; 13: 012003. |
| [12] | McNider RT, Steeneveld GJ. Response and sensitivity of the nocturnal boundary layer over land to added longwave radiative forcing. J Geophys Res 2012; 117(D14) [http://dx.doi.org/10.1029/2012SJDOI7578] |
| [13] | Salamanca F, Georgescu M, Mahalov A, Moustaoui M. Summertime response of temperature and cooling energy demand to urban expansion in a semiarid environment. J Appl Meteorol Climatol 2015; 54: 1756-72. [http://dx.doi.org/10.1175/JAMC-D-14-0313.1] |
| [14] | Karl TR, Jones PD, Knight RW, et al. A new perspective on recent global warming: Asymmetric trends of daily maximum and minimum temperature. Bull Am Meteor 1993; 74: 1007: 1023. |
| [15] | Torok SJ, Morris CJ, Skinner C, Plummer N. Urban heat island features of southeast Australian towns. Aust Met Mag 2001; 50: 1-13. |
| [16] | van Wijngaarden WA. Arctic temperature trends from the early nineteenth century to the present. Theor Appl Climatol 2015; 122: 567-80. [http://dx.doi.org/10.1007/s00704-014-1311-z] |
| [17] | Torok SJ, Nicholls N. A historical annual temperature dataset for Australia. Aust Met Mag 1996; 45: 251-60. |
| [18] | Jones DA, Wang W, Fawcett R. High-quality spatial climate datasets or Australia. Aust Met Ocean J 2009; 58: 233-48. |
| [19] | Trewin B. A daily homogenized temperature dataset for Australia, Int. J Clim 2013; 33: 1510-29. [http://dx.doi.org/10.1002/joc.3530] |
| [20] | Ashcroft L, Karoly DJ, Gergis J. Southeastern Australian climate variability 1860-2009: a multivariate analysis. Int J Clim 2014; 34: 1928-44. [http://dx.doi.org/10.1002/joc.3812] |
| [21] | Trewin B. Techniques involved in developing the Australian Climate Observations Reference Network – Surface Air Temperature dataset, Center for Australian Weather and Climate Technical Report No 049. 2012. ISBN: 978 0 643 10815 8 |
| [22] | Fawcett RJ, Trewin BC, Braganza K, et al. On the sensitivity of Australian temperature trends and variability to analysis methods and observation networks, Center for Australian Weather and Climate Research Technical Report No 050. 2012. ISBN: 978 0 643 10819 6 |
| [23] | Australian Climate Observations Reference Network - Surface Air Temperature Dataset. Available at: https://data.gov.au/dataset/acorn-sat. [Accessed on: 15 June 2016] |
| [24] | KNMI Climate Explorer. Available at: https://climexp.knmi.nl [Accessed on: 15 June 2016] |
| [25] | Quirk T. The australian temperature anomaly, 1910-2000. Energy Environ 2009; 20: 97-100. [http://dx.doi.org/10.1260/095830509787689231] |
| [26] | Oke TR. The energetic basis of the urban heat island. Q J R Meteorol Soc 1982; 108: 1-24. |
| [27] | Santos F. Trees – Natural Air Conditioners. Scientific Scribbles University of Melbourne [Accessed on: 24 August 2016]; Available at: https://blogs.unimelb.edu.au/sciencecommunication/2013/08/23/ |