- Home
- About Journals
-
Information for Authors/ReviewersEditorial Policies
Publication Fee
Publication Cycle - Process Flowchart
Online Manuscript Submission and Tracking System
Publishing Ethics and Rectitude
Authorship
Author Benefits
Reviewer Guidelines
Guest Editor Guidelines
Peer Review Workflow
Quick Track Option
Copyediting Services
Bentham Open Membership
Bentham Open Advisory Board
Archiving Policies
Fabricating and Stating False Information
Post Publication Discussions and Corrections
Editorial Management
Advertise With Us
Funding Agencies
Rate List
Kudos
General FAQs
Special Fee Waivers and Discounts
- Contact
- Help
- About Us
- Search


The Open Atmospheric Science Journal
(Discontinued)
ISSN: 1874-2823 ― Volume 14, 2020
On Methane Leaks from Pipelines in Bryan and College Station, Texas, USA
Kristen Koch1, Shelby Thomas1, Elora Arana1, Geoff Roest2, Gunnar W. Schade2, *
Abstract
Methane is the second most important anthropogenically emitted greenhouse gas after carbon dioxide. Anthropogenic methane sources in the US are dominated by emissions from domestic ruminants and from fossil fuel exploration, storage and transmission. The fossil fuel source is primarily due to natural gas leaks along the production to distribution chain, and pipeline leaks in urban areas have been identified as a significant contributor. In this study, we evaluated possible leaks in three neighborhoods of a midsize Texas metropolitan region surrounding Texas A&M University through mobile measurements using a fast response, high precision methane analyzer. Neighborhoods were selected by age and land use, and each predetermined driving route was evaluated three times. Methane spikes exceeding 2.5 ppm were identified as leaks, and approximately one leak per mile of urban road was discovered. The largest leaks were found around the Texas A&M natural gas plant and in the oldest neighborhood to its north, while fewer leaks were found in a slightly younger neighborhood. No leaks were found in the youngest, less than 20-year old neighborhood suggesting that pipeline system age is a strong determinant of current and future leaks from the natural gas distribution system.
Article Information

Identifiers and Pagination:
Year: 2016Volume: 10
First Page: 56
Last Page: 62
Publisher Id: TOASCJ-10-56
DOI: 10.2174/1874282301610010056
Article History:
Received Date: 24/06/2016Revision Received Date: 27/09/2016
Acceptance Date: 27/09/2016
Electronic publication date: 31/10/2016
Collection year: 2016
open-access license: This is an open access article licensed under the terms of the Creative Commons Attribution-Non-Commercial 4.0 International Public License (CC BY-NC 4.0) (https://creativecommons.org/licenses/by-nc/4.0/legalcode), which permits unrestricted, non-commercial use, distribution and reproduction in any medium, provided the work is properly cited.
* Address correspondence to this author at the Texas A&M University, Department of Atmospheric Sciences, College Station, TX 77843-3150, USA, Tel: +1 (979) 845-0633; Fax: +1 (979) 862-4466; E-mail: gws@geos.tamu.edu
| Open Peer Review Details | |||
|---|---|---|---|
| Manuscript submitted on 24-06-2016 |
Original Manuscript | On Methane Leaks from Pipelines in Bryan and College Station, Texas, USA | |
INTRODUCTION
Methane is an odorless and colorless gas that accounts for approximately 10% of all greenhouse gases emitted by anthropogenic sources in the United States, second after carbon dioxide [1U.S. Environmental Protection Agency. Inventory of U.S. Greenhouse Gas Emissions and Sinks: 1990 – 2013 . Washington, DC: EPA. 2015. EPA 430-R-15-004. ]. Though methane has a short lifetime in the atmosphere of ten to twelve years, it has a global warming potential (GWP) 28 to 34 times stronger than carbon dioxide over a 100 year period [2Myhre G, Shindell D, Bréon F-M, et al. Anthropogenic and natural radiative forcing. In: Stocker TF, Qin D, Plattner G-K, Eds. Climate Change 2013: The Physical Science Basis Contribution of Working Group I to the 5th Assessment. Cambridge, United Kingdom and New York, NY, USA: Cambridge University Press 2013.], and 84 to 86 times stronger over a 20 year period. Northern hemispheric tropospheric concentrations (clean background air) of methane have nearly tripled since the Industrial Revolution from 0.72 ppm to 1.8 ppm, and methane presently exhibits the second highest anthropogenic greenhouse forcing after carbon dioxide [2Myhre G, Shindell D, Bréon F-M, et al. Anthropogenic and natural radiative forcing. In: Stocker TF, Qin D, Plattner G-K, Eds. Climate Change 2013: The Physical Science Basis Contribution of Working Group I to the 5th Assessment. Cambridge, United Kingdom and New York, NY, USA: Cambridge University Press 2013.]. Natural sources of methane, such as wetlands and ocean sediments, account for less than 40% of global emissions today.
The abundance of natural gas, which consists largely of methane, makes it an attractive fuel source, and it is vital for electricity and heat generation in industrial nations. In its Inventory of US Greenhouse Gas Emissions & Sinks [1U.S. Environmental Protection Agency.
Inventory of U.S. Greenhouse Gas Emissions and Sinks: 1990 – 2013
. Washington, DC: EPA. 2015.
EPA 430-R-15-004. ] EPA estimated that approximately 29% of the United States’ anthropogenic methane sources came from natural gas and petroleum systems, but atmospheric measurements have repeatedly shown this to be an underestimate [3Miller SM, Worthy DE, Michalak AM, et al. Observational constraints on the distribution, seasonality, and environmental predictors of North American boreal methane emissions. Global Biogeochem Cycles 2014; 28(2): 146-60.
[http://dx.doi.org/10.1002/2013GB004580] -6McKain K, Down A, Raciti SM, et al. Methane emissions from natural gas infrastructure and use in the urban region of Boston, Massachusetts. Proc Natl Acad Sci USA 2015; 112(7): 1941-6.
[http://dx.doi.org/10.1073/pnas.1416261112] [PMID: 25617375] ]. Methane emissions occur throughout the natural gas production, storage, transmission, and distribution chain. Natural gas used domestically is typically delivered to households and businesses through a distribution system of pipelines that run underneath the ground. For 2012, EPA estimated that the oil and gas industry emitted 398.3 billion cubic feet (Bcf) of methane into the atmosphere, 16% of which was from the distribution of natural gas from major pipelines (“mains”) to residential and commercial areas.
Several recent studies have made use of mobile monitoring to map the frequency and amount of high methane concentrations in urban areas as indicators of natural gas leaks, such as in Washington D.C [7Jackson RB, Down A, Phillips NG, et al. Natural gas pipeline leaks across Washington, DC. Environ Sci Technol 2014; 48(3): 2051-8.
[http://dx.doi.org/10.1021/es404474x] [PMID: 24432903] ], Boston, MA [8Phillips NG, Ackley R, Crosson ER, et al. Mapping urban pipeline leaks: methane leaks across Boston. Environ Pollut 2013; 173: 1-4.
[http://dx.doi.org/10.1016/j.envpol.2012.11.003] [PMID: 23174345] ], Durham, NC, Cincinatti, OH, and Manhattan (New York), NY [9Gallagher ME, Down A, Ackley RC, et al. Natural gas pipeline replacement programs reduce methane leaks and improve consumer safety. Environ Sci Technol Lett 2015; 2(10): 286-91.
[http://dx.doi.org/10.1021/acs.estlett.5b00213] ], as well as in several more cities investigated in the Environmental Defense Fund’s collaborative project with Google Earth outreach, Colorado State University, and various utility companies (https://www.edf.org/climate/methanemaps/partnership). A more detailed look at the Boston, MA emissions revealed that 60-100% of the total emissions could be attributed to natural gas leaks, with a fractional loss rate of approximately 3% as compared to local consumption [6McKain K, Down A, Raciti SM, et al. Methane emissions from natural gas infrastructure and use in the urban region of Boston, Massachusetts. Proc Natl Acad Sci USA 2015; 112(7): 1941-6.
[http://dx.doi.org/10.1073/pnas.1416261112] [PMID: 25617375] ]. The mobile monitoring studies all concluded that there is a positive relationship between the age of natural gas pipes (cast/wrought iron pipes vs. newer materials) and the frequency of methane leaks. Older pipelines are more susceptible to leaks because of pipeline disintegration over time [9Gallagher ME, Down A, Ackley RC, et al. Natural gas pipeline replacement programs reduce methane leaks and improve consumer safety. Environ Sci Technol Lett 2015; 2(10): 286-91.
[http://dx.doi.org/10.1021/acs.estlett.5b00213] ].
The purpose of this study was to analyze methane leaks in a midsize urban area in Texas using mobile monitoring, and to determine whether leakage rates vary due to the relative age of the local pipelines. The study was part of an undergraduate capstone course in Environmental Geosciences, thus limiting the scope and duration of the study. Methane concentration measurements were collected in three different urban neighborhoods of Bryan and College Station, Texas, USA, during fall 2015. The local gas utility company in charge of the urban pipeline network was contacted several times during the project but remained unresponsive.
METHODS
Analyzer and Vehicle Setup
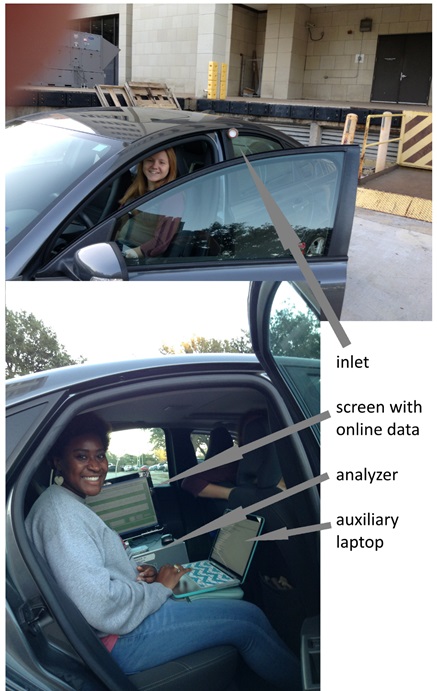
A Picarro model G2204 CRDS analyzer with pump assembly was used to observe methane, hydrogen sulfide (H2S), and water vapor levels while driving an ordinary passenger car along pre-designated routes. To provide the 110 VAC needed to power the analyzer a DC to AC power inverter was connected to an external car battery. Ambient air from outside the left rear window of the car was aspirated through a glass fiber filter in an open face filter holder connected to approximately two meters of ¼ OD Perfluoroalkoxy (PFA) Teflon sample tubing en-route to the analyzer on the back seat of the vehicle. Sample lag time from the inlet to detection was less than 2 s as tested via exhaling near the inlet filter. Fig. (1 ) shows two pictures of the setup. The analyzer’s methane calibration was checked with ultrapure air and an external calibration gas containing 2.02 ±0.04 ppm methane in air (Scott-Marrin Inc., CA) and found to be precise to better than 2% (2 sd) and accurate within the standard’s 2% uncertainty in the laboratory.
The analyzer keeps track of interfering water vapor and CO2 concentrations in the air sample for internal corrections to its methane output. The water vapor abundance adjustment is the primary correction applied, assuring a precision of the dry gas mixing ratio methane measurement of better than 3 ppb [10Rella C. Accurate greenhouse gas measurements in humid gas streams using the picarro G1301 carbon dioxide / methane / water vapor gas analyzer sunnyvale. CA: Picarro Inc. 2010; p. 18.]. CO2 is estimated only to a relative precision of approximately 16% at 500 ppm (2 sd). Since CO2 is also corrected for water vapor abundances, dry air CO2 calibration gas measurements were inaccurate (biased high). However, the analyzer produced expected and reasonable ambient CO2 measurements (390-450 ppm [11Elser M, Bozzetti C, El-Haddad I, et al. Urban increments of gaseous and aerosol pollutants and their sources using mobile aerosol mass spectrometry measurements. Atmos Chem Phys 2016; 16(11): 7117-34.
[http://dx.doi.org/10.5194/acp-16-7117-2016] ]) in our urban area under near-constant water vapor concentrations.
Investigated Routes
The driving routes were chosen to be representative of the urban areas investigated and to analyze key natural gas consumption areas, such as residential neighborhoods, the Texas A&M University campus with its own natural gas power plant, and adjacent commercial areas. Another distinguishing factor was the comparison between areas containing relatively older versus newer pipelines. The first route went through the “Northgate” area, representative of commercial land use, a natural gas power plant on the Texas A&M campus, and a more than 60 year old residential area north of the campus belonging to Bryan. The second route went through the “Southgate” area, a 50-60 year old residential neighborhood of College Station south of the campus. The third route, “Creek View”, was representative of newer residential neighborhoods (10-15 years old) of College Station, approximately 6-7 km southeast of campus.
Each route was driven three times during two weeks in November 2015. One set of measurements for each route occurred in the morning between 0900 and 1100 h local time and the other two sets of measurements were taken in the late afternoon around sunset (after 1700 h), thus accounting for changes in atmospheric stability during the day affecting the results. When driving a designated route, typical speeds were 15 mph in residential neighborhoods and 25 mph on main roads. All routes together covered a total of approximately 21 miles of urban roads. Following previous work [7Jackson RB, Down A, Phillips NG, et al. Natural gas pipeline leaks across Washington, DC. Environ Sci Technol 2014; 48(3): 2051-8.
[http://dx.doi.org/10.1021/es404474x] [PMID: 24432903] , 9Gallagher ME, Down A, Ackley RC, et al. Natural gas pipeline replacement programs reduce methane leaks and improve consumer safety. Environ Sci Technol Lett 2015; 2(10): 286-91.
[http://dx.doi.org/10.1021/acs.estlett.5b00213] ], a “leak” was defined as a methane reading of higher than 2.5 ppm. The analyzer was pre-set to take measurements at a frequency of one hertz and general observations were made and recorded during and after the route, including the methane baseline readings of ambient air, and weather observations. Measurement location and average vehicle speed were tracked using a cell-phone tracking app for iOS called RAAH (http://raah.co), which provided 10-s position and speed logging online.
Weather Conditions
Weather conditions during all investigative drives were similar, and are summarized in Table 1. The Bryan/College Station metropolitan area in east Texas, 100 m asl, is located in a typical subtropical humid climate (Koeppen classification Cfa), with hot and humid summers, mild winters, and near uniform month-to-month precipitation. Average high and low November air temperatures are 22 and 11 °C, with November 2015 near average climatologically. During the three days of driving the predetermined routes (10, 12, and 19 November) clear skies dominated on two days, while one day was partly cloudy. Rainfall occurred on 11 (<1 mm) and 17 November (48 mm) due to cold front passages. Thus, most measurements were taken under high pressure influence and relatively low wind speeds (Table 1).
RESULTS AND DISCUSSION
Fig. (2) provides an overview of the location of the driven routes in the Bryan/College Station urban area, alongside individual bars representing the levels and locations of each spike during all 9 investigations. We identified 25 “leaks” exceeding 2.5 ppm methane over 21 miles of road in all study areas. Thus, the combined density (number of leaks per mile) for all 3 routes was approximately one leak per mile, much lower than findings in Boston and Washington [7Jackson RB, Down A, Phillips NG, et al. Natural gas pipeline leaks across Washington, DC. Environ Sci Technol 2014; 48(3): 2051-8.
[http://dx.doi.org/10.1021/es404474x] [PMID: 24432903] , 8Phillips NG, Ackley R, Crosson ER, et al. Mapping urban pipeline leaks: methane leaks across Boston. Environ Pollut 2013; 173: 1-4.
[http://dx.doi.org/10.1016/j.envpol.2012.11.003] [PMID: 23174345] ] but comparable to other cities driven in EDF’s partnership project, such as several areas in Dallas, TX, which showed one leak for every two miles driven. The leak with the highest concentration of methane in our study areas was recorded at 10.7 ppm (Table 1). Fewer leaks were recorded during the morning drives, likely due to the recent rise of the boundary layer and a more turbulent surface layer.
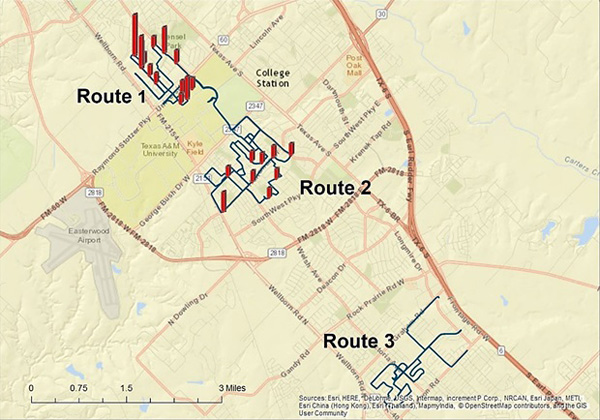
Table 1 summarizes the results from the three study areas and drives. Notable observations include (1) increased leak detection probability under calm wind conditions, (2) higher background methane levels (minima and means) under southerly as compared to northerly air mass origins, (3) spikes around the campus’ natural gas plant, which is fed via a transmission main pipeline along University Drive coming from the ENE, and (4) a few spikes that may not have been directly related to pipeline leaks but natural sources, such as methanogenesis in a low lying, possibly swampy area, or soil disturbances at a large constructions site.
Methane measurement statistics and weather conditions at a station several kilometers west of College Station during the nine investigative drives of this study. Methane mixing ratios are given in ppm, mean wind direction in cardinal directions, mean wind speed in meters per second, mean air temperatures in degrees Celsius, and pressure in millibars (with trend indicated by arrow). Methane means and standard deviations exclude all data above 2.5 ppm (methane “spikes”).
Most leaks were recorded under low wind speed conditions in the Northgate area, which is popular with university students due to its nearness to campus, numerous eateries, and affordable housing options in a very old neighborhood. Commercial use of natural gas and many small leaks may explain the slightly higher methane data standard deviations in this area. Almost as many leaks were observed in the Southgate study area, first developed in the 1950s and 60s, although spike sizes were lower. This area is exclusively residential and some of the varying background and standard deviation of methane may have been related to soil sources along a creek the driving route passed several times. In addition, the utility company began updating natural gas service lines and valves in parts of the area in fall 2015. Lowest background readings were observed toward its west side, where newer student apartments are located.
Lastly, the Creek View study area had the lowest background readings and smallest standard deviation, showing no spikes above 2.5 ppm during any of the three investigations. Nevertheless, several elevated methane readings were observed even in this neighborhood. Since the neighborhood is less than 20 years old, pipelines in this area are younger and have probably not been exposed to as much wear over time as older pipes in the Northgate and Southgate study areas.
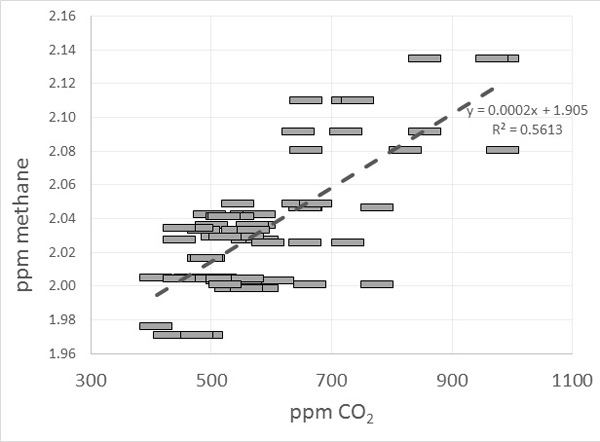
We also investigated several situations when the car travelled in dense afternoon rush-hour traffic. While carbon dioxide data were strongly elevated under such conditions, as expected from similar measurements in flowing traffic or near-road areas [11Elser M, Bozzetti C, El-Haddad I, et al. Urban increments of gaseous and aerosol pollutants and their sources using mobile aerosol mass spectrometry measurements. Atmos Chem Phys 2016; 16(11): 7117-34.
[http://dx.doi.org/10.5194/acp-16-7117-2016] -16Maness HL, Thurlow ME, McDonald BC, Harley RA. Estimates of CO2 traffic emissions from mobile concentration measurements. Atmospheres 2015; 120(5): 2087-102.
[http://dx.doi.org/10.1002/2014JD022876] ], methane was not. Nevertheless, the high precision of the analyzer allowed for several estimates of molar methane to CO2 emission ratios from traffic, an example shown in Fig. (3). The obtained ratio of 2×10⁻⁴ was found to be reproducible, but was larger though broadly consistent with data given by Nam and coworkers [17Nam EK, Jensen TE, Wallington TJ. Methane emissions from vehicles. Environ Sci Technol 2004; 38(7): 2005-10.
[http://dx.doi.org/10.1021/es034837g] [PMID: 15112800] ] for a US 1995-1999 car fleet, and Popa and coworkers [18Popa ME, Vollmer MK, Jordan A, et al. Vehicle emissions of greenhouse gases and related tracers from a tunnel study: CO: CO2, N2O: CO2, CH4: CO2, O2: CO2 ratios, and the stable isotopes 13C and 18O in CO2 and CO. Atmos Chem Phys 2014; 14(4): 2105-23.
[http://dx.doi.org/10.5194/acp-14-2105-2014] ] for a more recent central European car fleet. More recent US data from Guha et al. [19Guha A, Gentner DR, Weber RJ, Provencal R, Goldstein AH. Source apportionment of methane and nitrous oxide in California's San Joaquin Valley at CalNex 2010 via positive matrix factorization. Atmos Chem Phys 2015; 15(20): 12043-63.
[http://dx.doi.org/10.5194/acp-15-12043-2015] ] for the modern car fleet in California also resulted in a much larger estimate of methane contributions from traffic, although not derived from direct measurements. However, our results should be viewed with caution: Even though CO2 was measured at very similar levels as compared to other recent in-traffic data [11Elser M, Bozzetti C, El-Haddad I, et al. Urban increments of gaseous and aerosol pollutants and their sources using mobile aerosol mass spectrometry measurements. Atmos Chem Phys 2016; 16(11): 7117-34.
[http://dx.doi.org/10.5194/acp-16-7117-2016] , 14Henninger S. Analysis of near surface CO2 variability within the urban area of Essen, Germany. Meteorologische Zeitschrift 2008; 17(1): 19-27.
[http://dx.doi.org/10.1127/0941-2948/2008/0261] , 16Maness HL, Thurlow ME, McDonald BC, Harley RA. Estimates of CO2 traffic emissions from mobile concentration measurements. Atmospheres 2015; 120(5): 2087-102.
[http://dx.doi.org/10.1002/2014JD022876] ], the instrument’s low precision for CO2 and lack of direct calibration may have caused small but significant biases.
CONCLUSION
We observed a clear relationship between the age of three neighborhoods in the College Station and Bryan, TX, urban area and the amount of observed methane leaks, similar to a recent study in three much larger metropolitan areas [9Gallagher ME, Down A, Ackley RC, et al. Natural gas pipeline replacement programs reduce methane leaks and improve consumer safety. Environ Sci Technol Lett 2015; 2(10): 286-91.
[http://dx.doi.org/10.1021/acs.estlett.5b00213] ]. Compared to previous studies the amount of leaks detected in this study, approximately one per mile of road travelled, was lower than in the older metropolitan areas of Boston, MA, and Washington D.C., but higher than in Durham, NC, or Cincinnati, OH [7Jackson RB, Down A, Phillips NG, et al. Natural gas pipeline leaks across Washington, DC. Environ Sci Technol 2014; 48(3): 2051-8.
[http://dx.doi.org/10.1021/es404474x] [PMID: 24432903] -9Gallagher ME, Down A, Ackley RC, et al. Natural gas pipeline replacement programs reduce methane leaks and improve consumer safety. Environ Sci Technol Lett 2015; 2(10): 286-91.
[http://dx.doi.org/10.1021/acs.estlett.5b00213] ]. However, these urban areas also have population densities 5 times higher than in College Station and Bryan, TX (Boston: 12,900/sq. mi; D.C.: 10,528/sq. mi; College Station: 1,978/sq. mi) (US Census Bureau data, 2013). Assuming that high population density is correlated with higher pipeline density in these metropolitan areas, the number of leaks per mile of pipeline, including service lines, may be more similar than the current field measurements suggest [9Gallagher ME, Down A, Ackley RC, et al. Natural gas pipeline replacement programs reduce methane leaks and improve consumer safety. Environ Sci Technol Lett 2015; 2(10): 286-91.
[http://dx.doi.org/10.1021/acs.estlett.5b00213] ]. In addition, the City of College Station, including part of its Northgate area belonging to Bryan, is a young community (established after the 2nd world war) and thus pipelines, regardless of material, have had less time to degrade than in older cities.
As our study was of limited scope spatially and temporally, akin to a pilot project, the results should not be extrapolated to this or other urban areas in Texas, especially when not serviced by the same natural gas provider. Nevertheless, from our measurements it is obvious that the newest pipelines in the youngest urban development areas have the lowest leak rates. Older pipelines require either maintenance or replacement to prevent current and future leaks. According to data maintained by the US Department of Transportation, Pipeline and Hazardous Materials Safety Administration (US-DOT-PHMSA), the local natural gas utility provider maintained 600 miles of cast or wrought iron main line pipelines in Texas at the end of 2015 (approx. 0.5% of all main lines in Texas). However, no distribution/service lines from these mains to residential or commercial consumers in Texas are listed as cast or wrought iron any longer since 2012. Thus, we can assume that the leaks we observed are most likely not related to old iron piping used for consumer distribution/service lines, but either stem from older main lines, or from leaks at aged joints, valves, or gas meters.
LIST OF ABBREVIATIONS
| EDF | = Environmental Defense Fund |
| EPA | = Environmental Protection Agency |
| GWP | = Global Warming Potential |
| US-DOT-PHMSA | = United States Department of Transportation, Pipeline and Hazardous Materials Safety Administration |
CONFLICT OF INTEREST
The authors confirm that this article content has no conflict of interest.
ACKNOWLEDGEMENTS
This project was part of a problem-based learning capstone course (GEOS 405) in the College of Geosciences Environmental Programs at Texas A&M University in College Station. We are grateful to the Environmental Defense Fund and its employees at the regional office in Austin, Texas, for lending us their Picarro CH4/H2S analyzer for this project, and to the Environmental Program’s office for the generous support of our endeavors. The open access publishing fees for this article have been covered by the Texas A&M University Open Access to Knowledge Fund (OAKFund), supported by the University Libraries and the Office of the Vice President for Research Financial support was provided through the College of Geosciences Environmental Programs’ office.
REFERENCES
| [1] | U.S. Environmental Protection Agency. Inventory of U.S. Greenhouse Gas Emissions and Sinks: 1990 – 2013 . Washington, DC: EPA. 2015. EPA 430-R-15-004. |
| [2] | Myhre G, Shindell D, Bréon F-M, et al. Anthropogenic and natural radiative forcing. In: Stocker TF, Qin D, Plattner G-K, Eds. Climate Change 2013: The Physical Science Basis Contribution of Working Group I to the 5th Assessment. Cambridge, United Kingdom and New York, NY, USA: Cambridge University Press 2013. |
| [3] | Miller SM, Worthy DE, Michalak AM, et al. Observational constraints on the distribution, seasonality, and environmental predictors of North American boreal methane emissions. Global Biogeochem Cycles 2014; 28(2): 146-60. [http://dx.doi.org/10.1002/2013GB004580] |
| [4] | Turner AJ, Jacob DJ, Wecht KJ, et al. Estimating global and North American methane emissions with high spatial resolution using GOSAT satellite data. Atmos Chem Phys 2015; 15(12): 7049-69. [http://dx.doi.org/10.5194/acp-15-7049-2015] |
| [5] | Katzenstein AS, Doezema LA, Simpson IJ, Blake DR, Rowland FS. Extensive regional atmospheric hydrocarbon pollution in the southwestern United States. Proc Natl Acad Sci USA 2003; 100(21): 11975-9. [http://dx.doi.org/10.1073/pnas.1635258100] [PMID: 14530403] |
| [6] | McKain K, Down A, Raciti SM, et al. Methane emissions from natural gas infrastructure and use in the urban region of Boston, Massachusetts. Proc Natl Acad Sci USA 2015; 112(7): 1941-6. [http://dx.doi.org/10.1073/pnas.1416261112] [PMID: 25617375] |
| [7] | Jackson RB, Down A, Phillips NG, et al. Natural gas pipeline leaks across Washington, DC. Environ Sci Technol 2014; 48(3): 2051-8. [http://dx.doi.org/10.1021/es404474x] [PMID: 24432903] |
| [8] | Phillips NG, Ackley R, Crosson ER, et al. Mapping urban pipeline leaks: methane leaks across Boston. Environ Pollut 2013; 173: 1-4. [http://dx.doi.org/10.1016/j.envpol.2012.11.003] [PMID: 23174345] |
| [9] | Gallagher ME, Down A, Ackley RC, et al. Natural gas pipeline replacement programs reduce methane leaks and improve consumer safety. Environ Sci Technol Lett 2015; 2(10): 286-91. [http://dx.doi.org/10.1021/acs.estlett.5b00213] |
| [10] | Rella C. Accurate greenhouse gas measurements in humid gas streams using the picarro G1301 carbon dioxide / methane / water vapor gas analyzer sunnyvale. CA: Picarro Inc. 2010; p. 18. |
| [11] | Elser M, Bozzetti C, El-Haddad I, et al. Urban increments of gaseous and aerosol pollutants and their sources using mobile aerosol mass spectrometry measurements. Atmos Chem Phys 2016; 16(11): 7117-34. [http://dx.doi.org/10.5194/acp-16-7117-2016] |
| [12] | Cheng YH, Chang HP, Hsieh CJ. Short-term exposure to PM10, PM2.5, ultrafine particles and CO2 for passengers at an intercity bus terminal. Atmos Environ 2011; 45(12): 2034-42. [http://dx.doi.org/10.1016/j.atmosenv.2011.01.061] |
| [13] | Crilley LR, Knibbs LD, Miljevic B, et al. Concentration and oxidative potential of on-road particle emissions and their relationship with traffic composition: Relevance to exposure assessment. Atmos Environ 2012; 59: 533-9. [http://dx.doi.org/10.1016/j.atmosenv.2012.05.039] |
| [14] | Henninger S. Analysis of near surface CO2 variability within the urban area of Essen, Germany. Meteorologische Zeitschrift 2008; 17(1): 19-27. [http://dx.doi.org/10.1127/0941-2948/2008/0261] |
| [15] | Lahde T, Niemi JV, Kousa A, et al. Mobile particle and NOx emission characterization at helsinki downtown: comparison of different traffic flow areas. Aerosol Air Qual Res 2014; 14(5): 1372-82. |
| [16] | Maness HL, Thurlow ME, McDonald BC, Harley RA. Estimates of CO2 traffic emissions from mobile concentration measurements. Atmospheres 2015; 120(5): 2087-102. [http://dx.doi.org/10.1002/2014JD022876] |
| [17] | Nam EK, Jensen TE, Wallington TJ. Methane emissions from vehicles. Environ Sci Technol 2004; 38(7): 2005-10. [http://dx.doi.org/10.1021/es034837g] [PMID: 15112800] |
| [18] | Popa ME, Vollmer MK, Jordan A, et al. Vehicle emissions of greenhouse gases and related tracers from a tunnel study: CO: CO2, N2O: CO2, CH4: CO2, O2: CO2 ratios, and the stable isotopes 13C and 18O in CO2 and CO. Atmos Chem Phys 2014; 14(4): 2105-23. [http://dx.doi.org/10.5194/acp-14-2105-2014] |
| [19] | Guha A, Gentner DR, Weber RJ, Provencal R, Goldstein AH. Source apportionment of methane and nitrous oxide in California's San Joaquin Valley at CalNex 2010 via positive matrix factorization. Atmos Chem Phys 2015; 15(20): 12043-63. [http://dx.doi.org/10.5194/acp-15-12043-2015] |